


Tremendous turnout for equities in 2019: Despite Sino-US trade spat
I’m probably preaching to the converted, but: beware media headlines. Bad news is shocking, and shocking sells newspapers. Sensationalist wording gets eyeballs on social media. Slick and surprising video footage gets clicks; so it goes, and has always; therefore journalists are trained to write exciting copy. In fact, larger media outlets have teams whose sole job is to come up with catchy headlines.
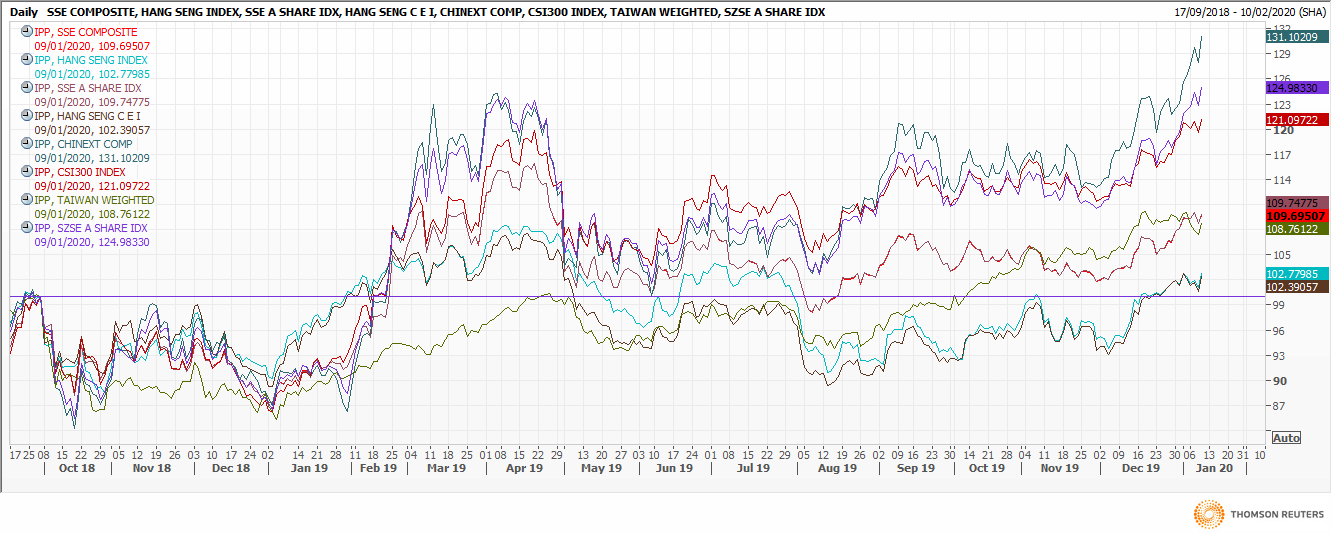
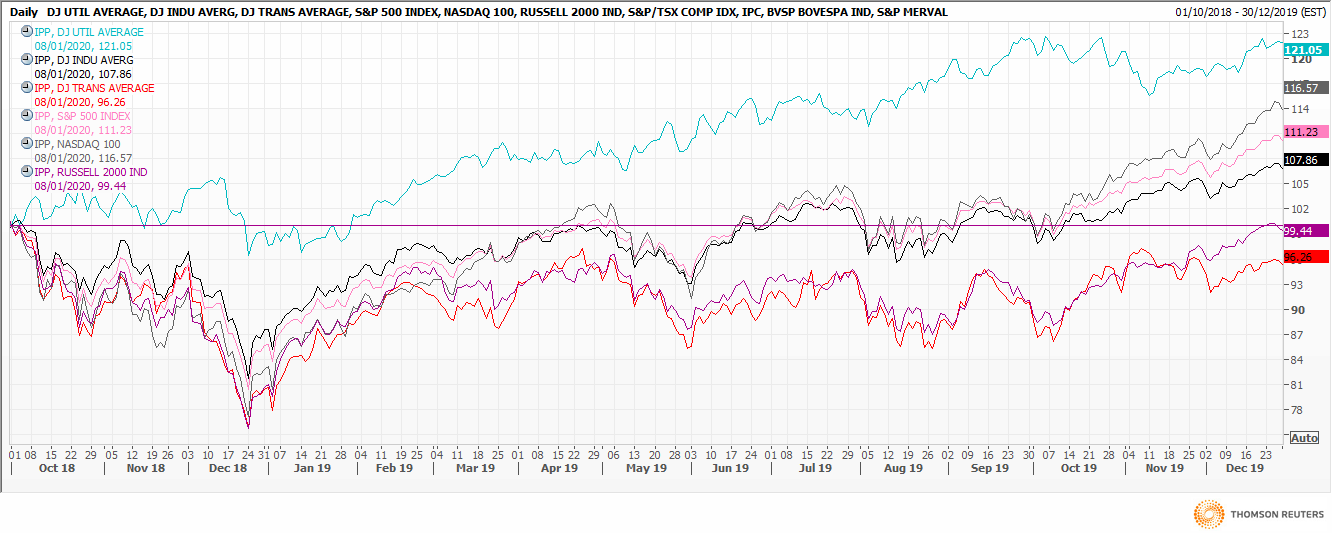
What’s this got to do with technical analysis, you ask. I mention it because of the plethora of year-end material covering the spectacular rallies in many equity indices – not to mention the proliferation of indices themselves! Stock brokers and fund managers understandably push their product, perhaps displaying relative rather than absolute performance. Nasdaq up 39 per cent in 2019, S&P500 up 28 per cent. Shenzhen A shares up 40 per cent, CSI300 up 37 per cent, even the Hang Seng up 11 per cent. All of this against a trade war between China and the US. Shows the negligible effect economics has on markets.
But what if we replaced the January 2019 start date with October 2018? The charts attached do this, one for US and the other for China-facing indices. Now you’ll see that while all Chinese indices ended up on the year, performance is more muted. Shenzhen’s still top dog, up 25 per cent, but Hang Seng’s barely budged at 2 per cent up. North American indices closed mainly higher, the Dow Utilities index the strongest, up 21 per cent, Dow Industrials a far more modest 8 per cent, while Dow Transports and the Russell are slightly down in the 15 months to December 31st 2019.
And if, instead, I had used October 1st 2019 as my cut-off date, you’d see that only Dow Utilities rallied, by almost 23 per cent, while the others were in negative territory – Transports and Russell a whopping 10-13 per cent off over the previous 12 months. Chinese indices in October 2019 were off 7 per cent in Hong Kong and for the Hang Seng China Enterprises; flat in Taiwan. The rest were up between 5 and 12 per cent. All very much more pedestrian, you’ll agree.
Propaganda for pension funds knows that the chosen starting point is key to performance. Smoke and mirrors?
Tags: Equities, percentage, Relative Performance, Start Point
The views and opinions expressed on the STA’s blog do not necessarily represent those of the Society of Technical Analysts (the “STA”), or of any officer, director or member of the STA. The STA makes no representations as to the accuracy, completeness, or reliability of any information on the blog or found by following any link on blog, and none of the STA, STA Administrative Services or any current or past executive board members are liable for any errors, omissions, or delays in this information or any losses, injuries, or damages arising from its display or use. None of the information on the STA’s blog constitutes investment advice.


Latest Comments