


The joys of spring! Well, that’s what the UK meteorological office tells me
The first of March is the official start of British spring according to the Met Office. Founded in 1854 and based in Exeter, Devon (nice work if you can get it), this quarterly point – which doesn’t coincide with our Gregorian calendar – is another good time to review one’s current situation and sketch out plans for the next three or six months.
In my garden I see buds emerging in some plants, and in my local parks and commons I’ve spotted plenty of daffodils and crocuses. I now learn that snowdrop collectors are a very keen lot, and are currently paying up to £1500 per bulb for rare specimens. Which set me thinking about tulips, markets and manias.
Financial media have lately focused on the big gains in some financial sectors, like US and European stocks, shipping rates and lumber. Do remember the laws of small versus big numbers: percentage changes from a big number involve a lot more ticks or points than those when starting from a tiny value.
So I’ve decided to look at monthly candlestick charts of a couple of key markets to decide whether they throw any light on the subject. 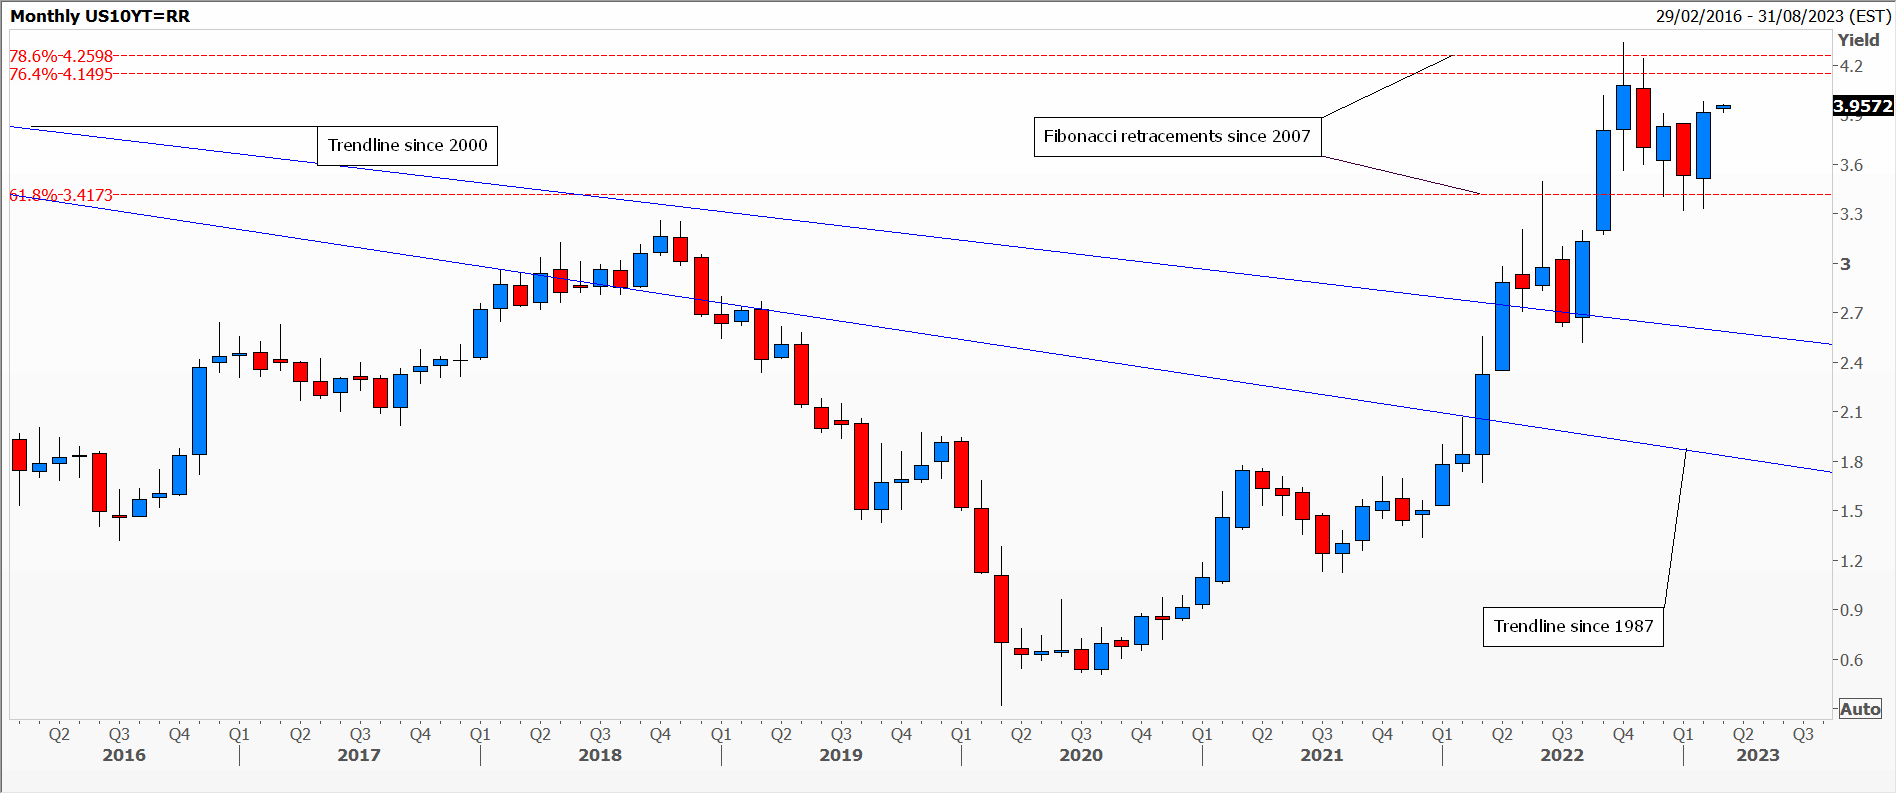 First of all, the yield on 10-year US Treasury Notes – which for quite some time have become the benchmark for many. You can see that the rally that took hold a year ago on breaking above very long term trend lines, peaked in October 2022 at Fibonacci retracement resistance. February 2023 is a marginally bullish engulfing candle, keeping yields in the current range. The MOVE bond volatility index also currently stands in the middle of the recent band. Nothing to shout about here.
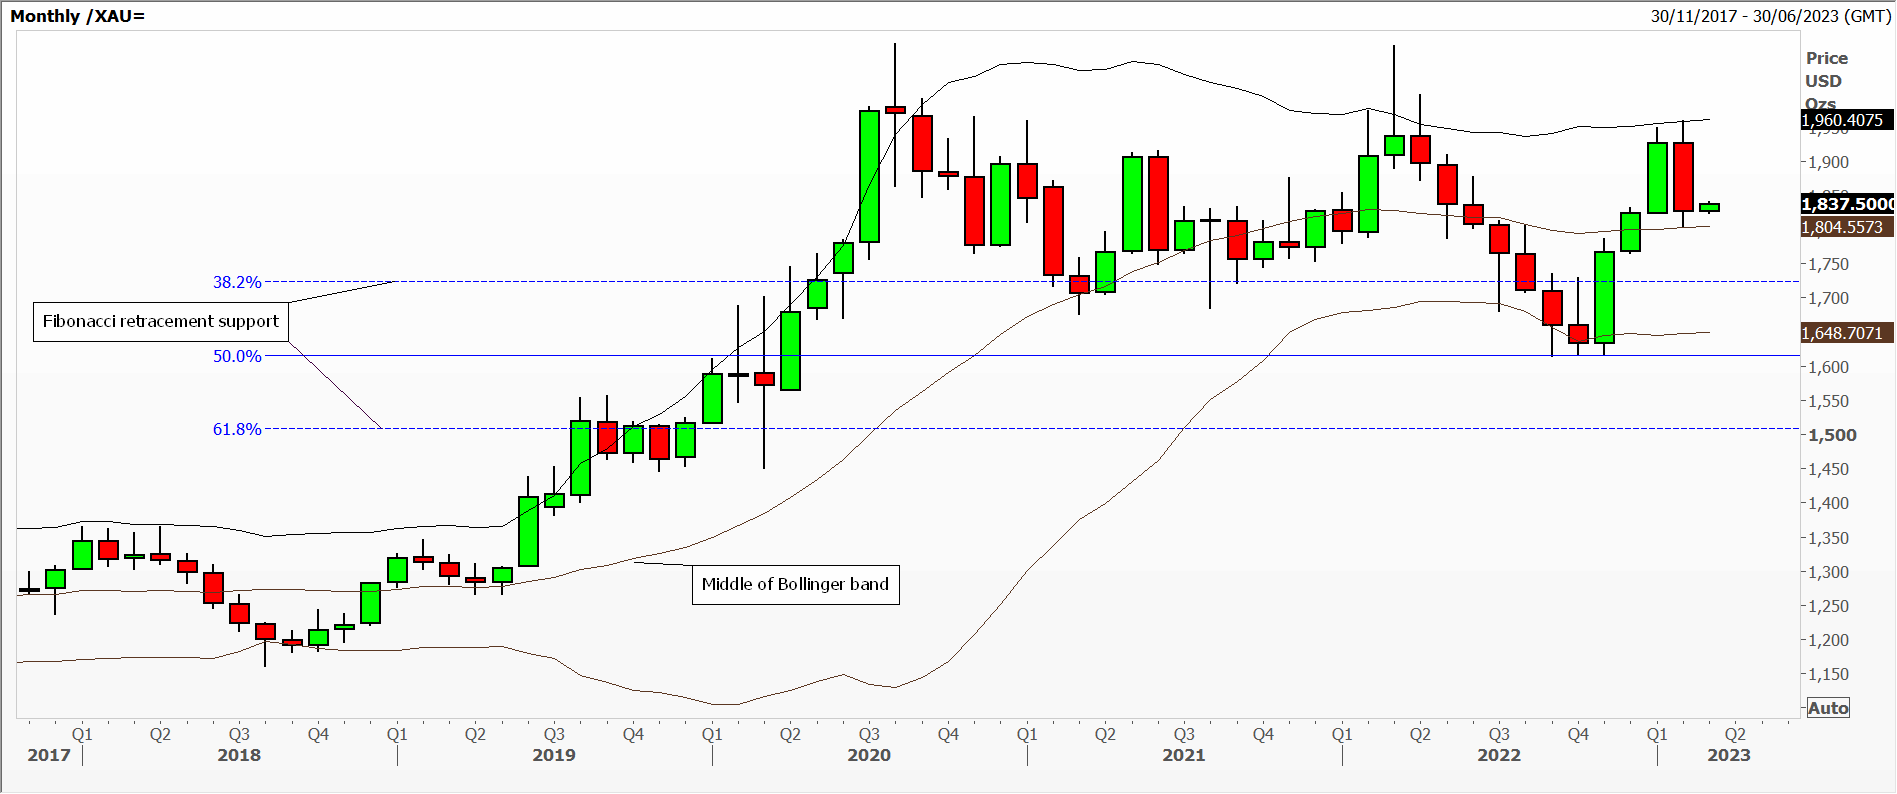 My second chart is that of spot gold, priced as US dollars per ounce, where you can see that we have been moving sideways in a wide range since the start of the Covid pandemic. February’s down candle reversed January’s rally, possibly forming a tweezers chart pattern against the top of the Bollinger band. One thing’s for sure, serious resistance lies around $2070.
Tags: monthly candles, quarters, spring
The views and opinions expressed on the STA’s blog do not necessarily represent those of the Society of Technical Analysts (the “STA”), or of any officer, director or member of the STA. The STA makes no representations as to the accuracy, completeness, or reliability of any information on the blog or found by following any link on blog, and none of the STA, STA Administrative Services or any current or past executive board members are liable for any errors, omissions, or delays in this information or any losses, injuries, or damages arising from its display or use. None of the information on the STA’s blog constitutes investment advice.


Latest Comments