


Thinking of couples and pairs: Seeing as it’s Valentine’s Day
Like many of the more irritating North American customs, celebrating February the 14th has become mainstream in the UK. Restaurants booked out with sorry tables for two, supermarket specials daubed with red hearts and, according to social media, Valentine cards for your new lockdown pooch. Remind me never to become a cat woman.
But it did make me start thinking about which aspects of technical analysis rely on patterns working in harmony, or in pairs, lines that are drawn as parallels or as tines of a fork.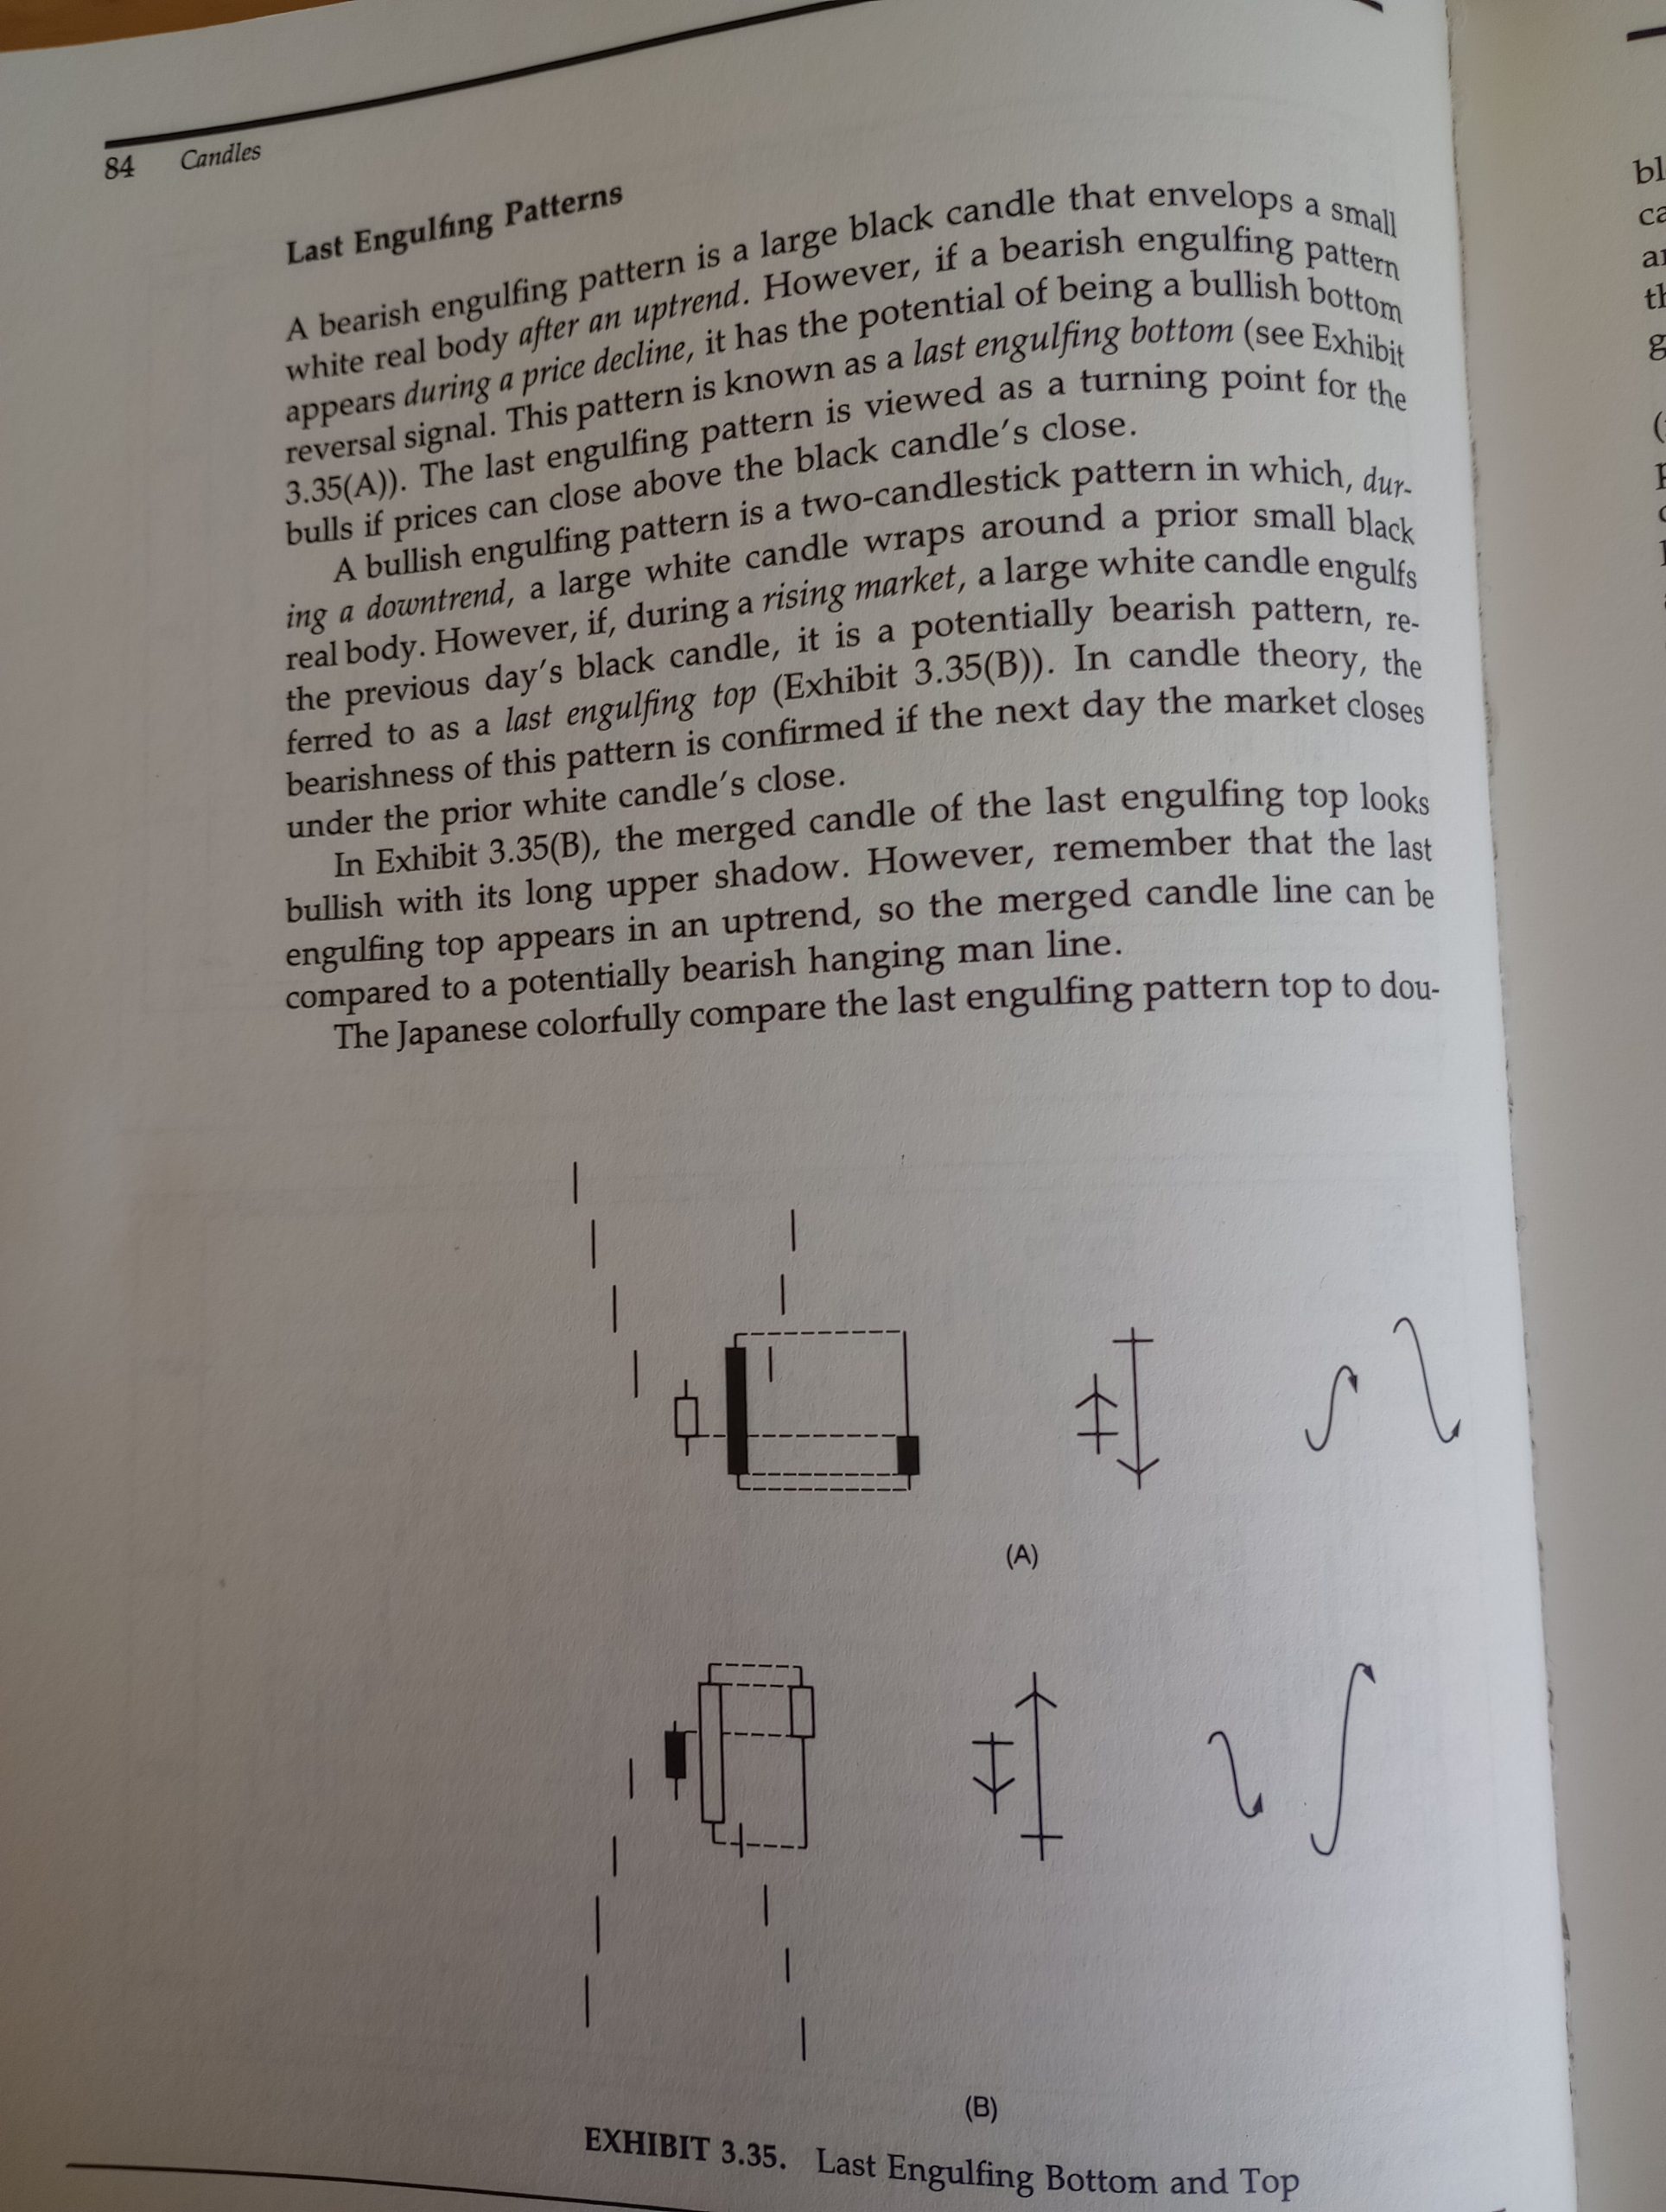
Perhaps the most obvious is a double top (which looks like a capital M) or a double bottom (a capital W). Then think of a trend channel, where in a bull market one joins up increasingly higher low points on the bars or candles, then adds a parallel linking up several of the highs on the way up. In a bear market one would draw the first line as a series of descending lower highs and the parallel linking as many lows as possible. Remember: when using candles one can focus on the bodies of the candles, ignoring the wicks/whiskers
A similar effect can be created mathematically by calculating the mean regression over a chosen period, and on either side of this plotting a standard deviation. Most statisticians use one or two standard deviations but I find that a Fibonacci 1.618 proportion around the mean often works well. The Andrews Pitchfork creates a channel that looks the same, but is plotted from a specific high or low with a pair of lines equidistant to the middle tine.
Candlesticks often work in pairs, two consecutive ones needed to create a pattern. A quick check in my trusty Steve Nison ‘Beyond Candlesticks’ includes the following: Dark Cloud Cover, Harami, Piercing Pattern, Engulfing Patterns and Last Engulfing Patterns. Most are well known but the latter is a tricky beast, so I’ve added a photo of it from my book (which incidentally cost $65.00 when first published in 1994). A bearish one (big black candle after a white one) occurs after a price decline and has the potential of being a reversal signal. Conversely a bullish Last Engulfing candlestick pair occurs in a bull market and is a big white candle after a smaller black one. One might think of it as the market’s last ‘Hurrah!’
Last ‘Hurrah’ for the commercialisation of St Valentine’s Day?
The views and opinions expressed on the STA’s blog do not necessarily represent those of the Society of Technical Analysts (the “STA”), or of any officer, director or member of the STA. The STA makes no representations as to the accuracy, completeness, or reliability of any information on the blog or found by following any link on blog, and none of the STA, STA Administrative Services or any current or past executive board members are liable for any errors, omissions, or delays in this information or any losses, injuries, or damages arising from its display or use. None of the information on the STA’s blog constitutes investment advice.


Latest Comments