


Rectangles and straightjackets: Can cause chaos
A very long time ago a journalist specialising in Indian stocks working for the Hindustan Times contacted me at the dealing room of the Japanese bank where I worked as a technical analyst. He wanted views and comment, especially on Mumbai’s stock index – something new to me then. Not being a slacker, I promptly set it up in my charting package and kept an eye on the subject – occasionally.
He’d enthusiastically follow up when the index moved higher, backing off when it was down again. Rather than waste more of our time, I told him bluntly that the market had traded in a tight, if cheap, range for many years and only when it properly broke higher, I would start covering that market properly.
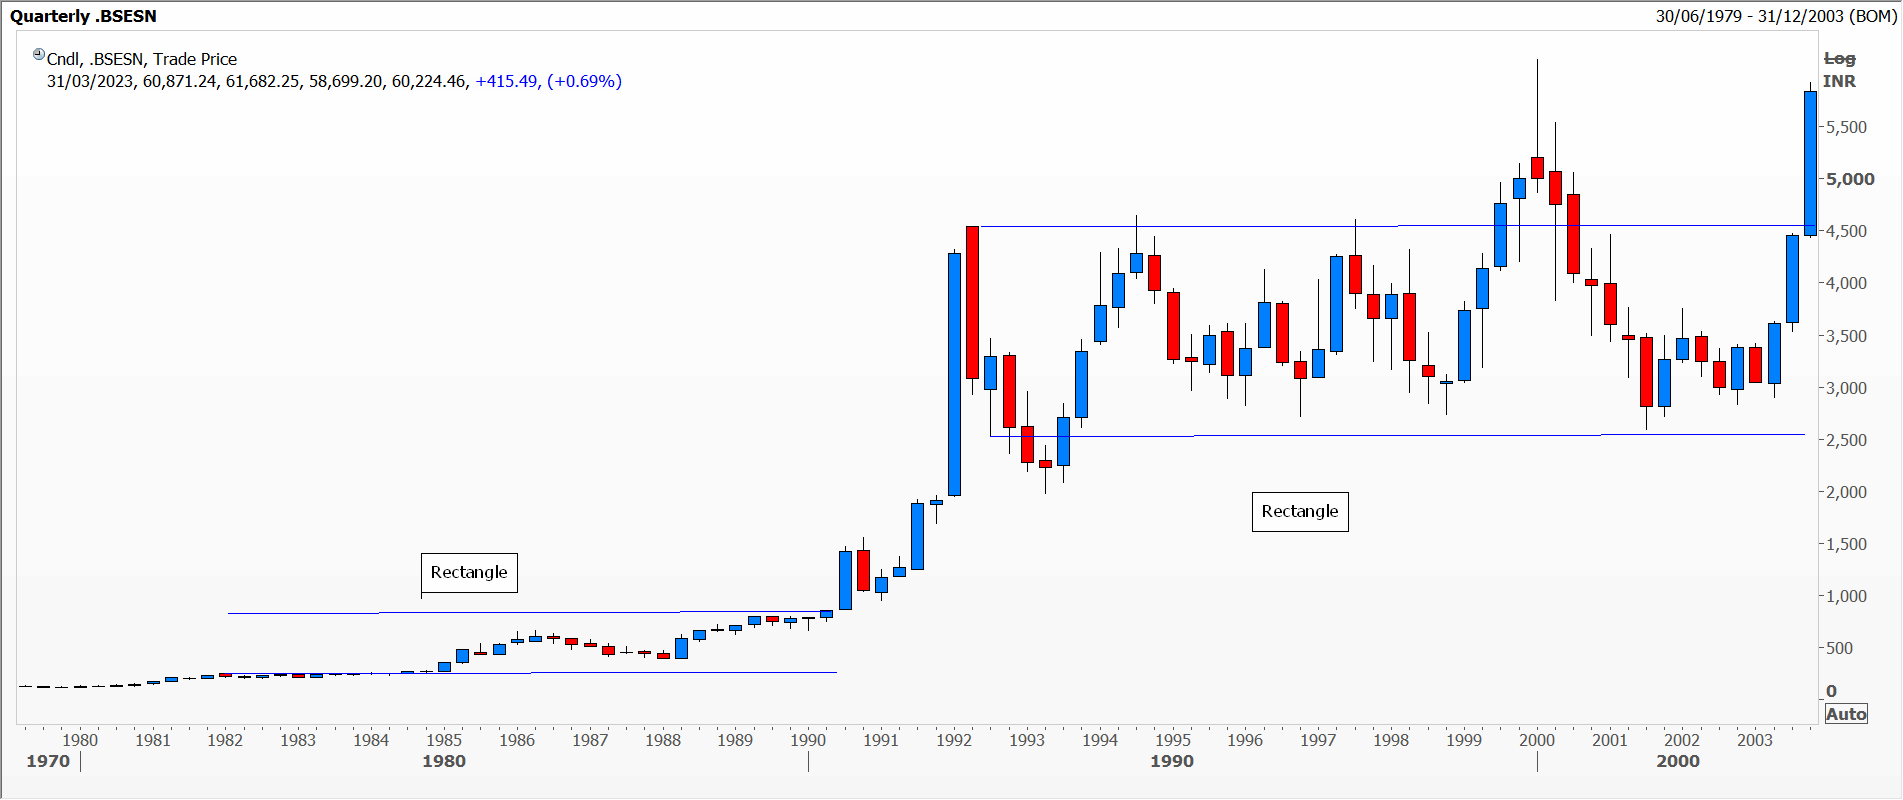
The quarterly chart on a logarithmic scale I attach starts in 1979 and ends in 2002; you will see exceptionally long sideways rectangles over this period. As a trader one can benefit from working the range; as an investor one can only hope for decent dividends. But should one see a breakout at either edge, the measured target is: first the height of the rectangle, then its width. Take a ruler and see for yourself what an upside target might be – because the index did break decidedly higher in December 2003.
The height would get you roughly to 6,200. I mentioned this on New Delhi TV – and they were delighted; it reached that level in December 2004. But the width’s target, well that’s something else. On a linear scale I reckon this might be roughly 21,000, reached at the end of 2007. On a log scale the target was closer to 62,000 which we reached in 2021.
This is an extreme example of what might happen, but European natural gas traders will be very aware of something like this in 2022, albeit with a lot less history. Chicago lean hog futures often trade in wide rectangles for decades, but rarely explode quite so much higher as pig farmers know their market. No squealing like a piggy.
Mumbai
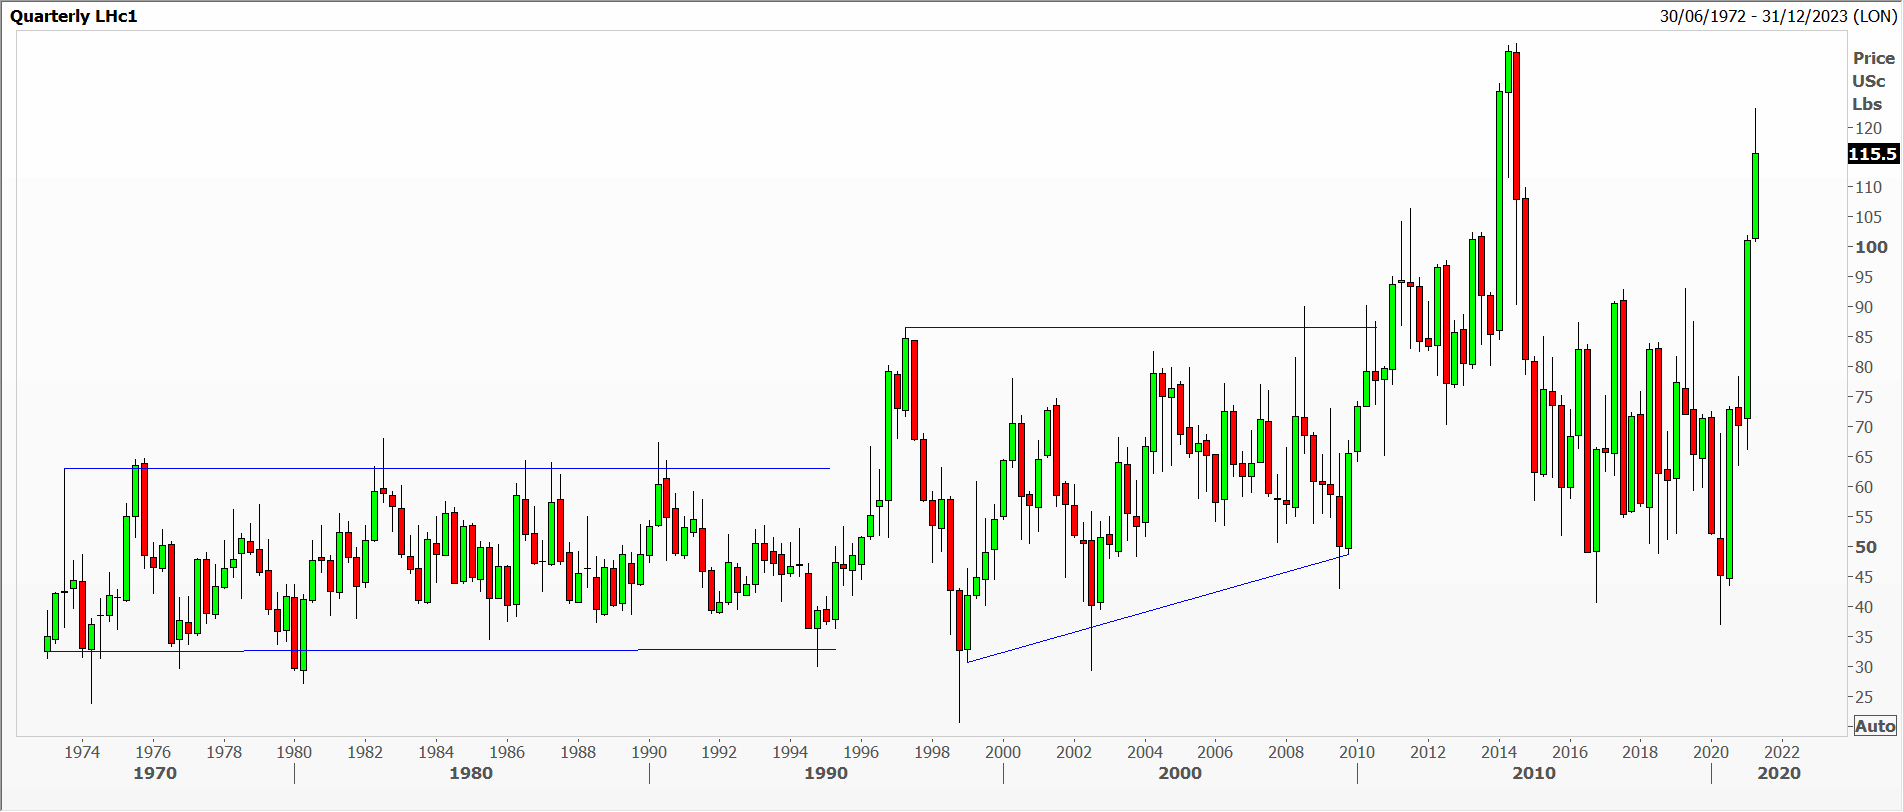
LeanHogs
Tags: Breakouts, measurements, Ranges, rectangle
The views and opinions expressed on the STA’s blog do not necessarily represent those of the Society of Technical Analysts (the “STA”), or of any officer, director or member of the STA. The STA makes no representations as to the accuracy, completeness, or reliability of any information on the blog or found by following any link on blog, and none of the STA, STA Administrative Services or any current or past executive board members are liable for any errors, omissions, or delays in this information or any losses, injuries, or damages arising from its display or use. None of the information on the STA’s blog constitutes investment advice.


Latest Comments