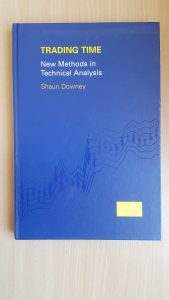
Shaun Downey: Trading Time
This month’s STA talk was ‘Trading Time: using the 4th dimension to create a 3rd spatial visualisation from a 2 dimensional image’. While that may sound like a strange and convoluted title the concept is fairly straight forward. How do you deal with the most important factor in trading – that of timing!? Shaun addresses this by working out how to deliver the important levels from charts  across different time frames on the one chart.
His talk was, by his own admission, a bit of a “tour de force”, trying to cover a huge amount in his allotted 1 hour! Shaun was for a long time a stalwart at CQG, still one of the leading charting software packages, especially amongst the professional Technical Analyst community. The start of his talk went into the problems of roll-over for Futures contracts and how he dealt with this (CQG is arguably one of the best platforms out there for giving you choices on this front). While at CQG he developed a set of rules, methods of analysis, and mathematical formulae which he collated and explained in his book ‘Tr ading Time’ www.trading-time.com. Published in 2007 and currently only available in an online version, luckily the STA library has a copy and our librarian John Douce kindly brought one along to show us. Shaun noted, ‘the best bit in my first book is in the appendix’!
Using his range defining methods (think Donchian Channels with tweaks) he is able to look at up to 7500 stocks a day – and has the time to do so because his system is clear visually and therefore speedy. He can rattle through them at a fair lick, as we saw! He mooted a number of methods he uses (many of which the audience had never heard of!), like ‘bear cage’, ‘open up space’, ‘power play symbol’, ‘slam dunk’ (to describe a chart pattern), ‘slingshot’ and ‘UFO’ (as a type of trade). Hopefully his forthcoming article(s) for the STA journal will shed some further light!
Clearly his many years at CQG were not wasted though, and he knows his biscuits. When asked whether it was time to put his theories into a ‘black box’, he thought no because his was a ‘grey box’ and a ‘glorified alert service reminding clients of chart levels’. While his inputs had all been coded and were actionable, programming it would be difficult, would remove the important element of individual choice, and then ‘you’d end up like gerbils going round and round in a cage not knowing when the system wasn’t working’.
Tags: deviation, moving averages, resistance, support, time frames
The views and opinions expressed on the STA’s blog do not necessarily represent those of the Society of Technical Analysts (the “STA”), or of any officer, director or member of the STA. The STA makes no representations as to the accuracy, completeness, or reliability of any information on the blog or found by following any link on blog, and none of the STA, STA Administrative Services or any current or past executive board members are liable for any errors, omissions, or delays in this information or any losses, injuries, or damages arising from its display or use. None of the information on the STA’s blog constitutes investment advice.
Latest Posts
- Why Your Post-Nominals Matter: MSTA & FTSA July 3, 2025
- How I Used Dow Theory to Strengthen My Market Convictions June 20, 2025
- The New Monetary Order: Russell Napier on Inflation, Debt, and Financial Repression June 12, 2025
- Why I Became (and remain) a Member of the STA May 29, 2025
- The Emotional Rollercoaster of Markets: Why Bubbles Repeat and How to Outsmart Them: Summary of Kim Cramer Larsson talk May 14, 2025


Latest Comments