


Of housing and hockey sticks: Anchoring and trends
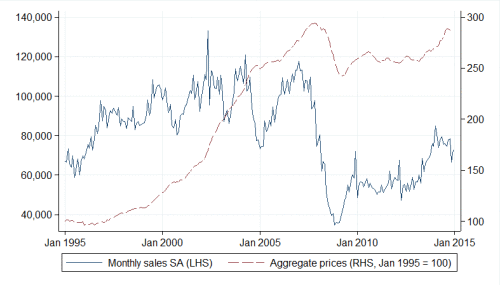
Recent research by the Bank of England using Land Registry data from 1995 shows that the chance of quickly flipping the home for a profit depends on when it was bought – and at what price, of course. At its core lies the concept of anchoring; buy high, aim high, sell less often. The amount of equity in the property is obviously important to those who want to trade up, but represents a smaller portion of expected house price gains than anchoring does. The price at which we bought, and reluctance to cut and run, therefore results in fewer price collapses but reduces geographic mobility.
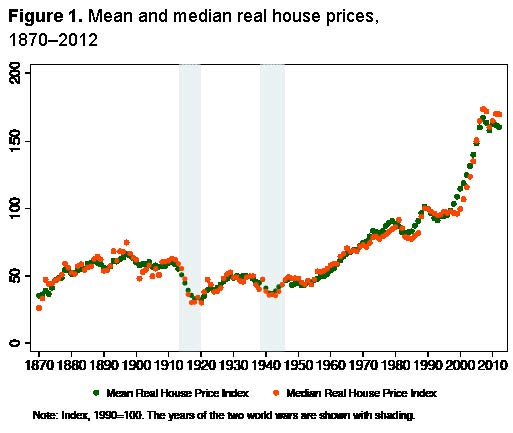
That’s all well and good but the data set is, quite frankly, tiny. Luckily Katharina Knoll and her colleagues at German universities have looked at house prices in 14 developed economies since 1870 using data from several official sources. They found that while Australia had the biggest and Germany the smallest price rises, all were remarkably similar, as were increases in urban versus rural areas, and farmland.
They conclude, and I quote, ‘real house prices display a pronounced hockey-stick pattern over the past 140 years. They stayed constant from the 19th to mid-20th century, but rose strongly in the second half of the 20th century [and continue to do so]. Sharply increasing land prices, not construction costs, were the key driver of this trend’. As the saying goes: buy land; they don’t make it any more.
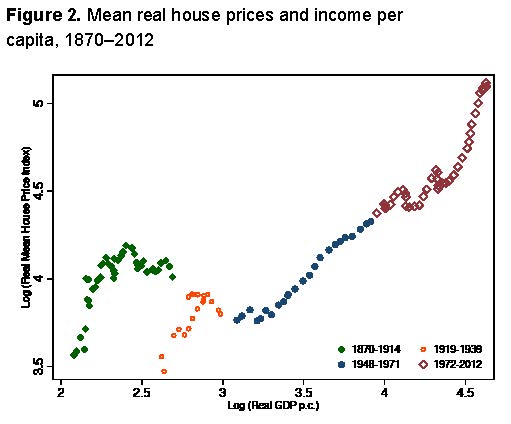
Also fascinating is the ratio of house purchase costs relative to income – a key driver to bank lending – against a background of real GDP growth. The outlier here seems to be the period between 1870 and 1914 where relatively slow economic growth was not reflected in rock bottom real estate relative to income. From then on increased economic growth led to a sustained trend to higher prices.
It makes one wonder whether some of the effect is caused by the lack of available credit and what, looking back in another 140 years, might be said of London – and Cambridge, Oxford and Bristol – where prices at 14.2 times income!
https://bankunderground.co.uk/2017/01/20/history-dependence-in-the-housing-market/
http://voxeu.org/article/home-prices-1870
Tags: collateral, House prices, wealth
The views and opinions expressed on the STA’s blog do not necessarily represent those of the Society of Technical Analysts (the “STA”), or of any officer, director or member of the STA. The STA makes no representations as to the accuracy, completeness, or reliability of any information on the blog or found by following any link on blog, and none of the STA, STA Administrative Services or any current or past executive board members are liable for any errors, omissions, or delays in this information or any losses, injuries, or damages arising from its display or use. None of the information on the STA’s blog constitutes investment advice.


Latest Comments