


Channelling the energy: Into parallel tracks
One of the nice things with networking at the STA’s monthly meetings is catching up with old friends and being reminded how we use different features of technical analysis. Glyn Bradney MSTA many years ago gave a lecture at this very event outlining research he had been doing with the concept of channels. Not conventional ones, drawn from either the highs or lows, with a parallel, but ones that attempt to capture the key energy in the market, the bands inside which most of the action takes place. It has similarities with standard deviations around a mean regression.
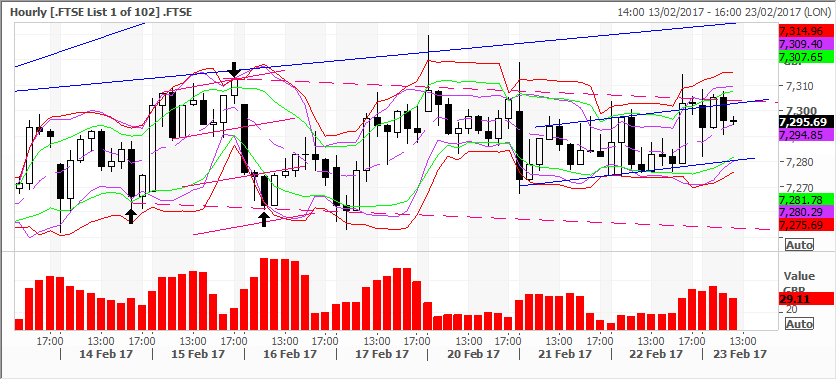
Glyn plots Energy Channels, the arrows on them marking the Maximum Bull/Bear consensus, often coupled with a type of Bollinger band around the candlesticks. Using all sorts of time frames, the shortest is usually an hourly period. He also uses conventional trend lines, patterns, and works out Wave counts.
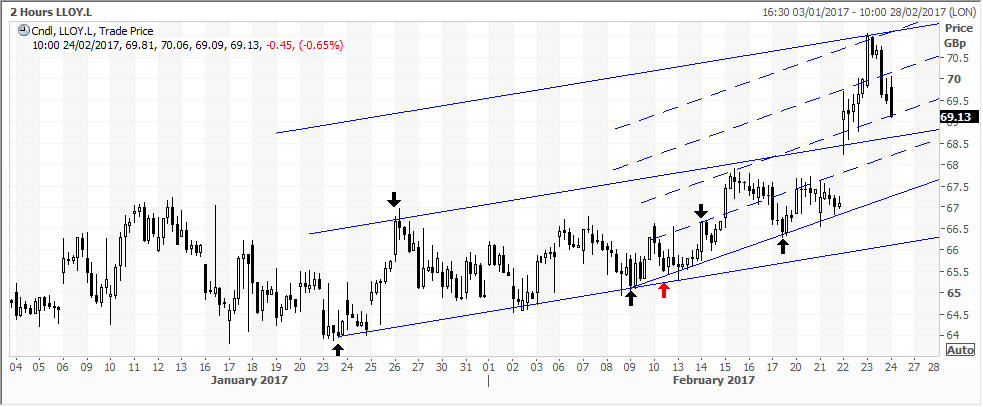
His chart of Lloyd’s Bank is interesting in its use of two-hourly candles. Note the inner and outer channels with their parallel lines. He says of this chart: ‘note the original lower definition point of the smaller channel (marked by red arrow) changes to the second black as that breaches the original line but immediately reverses. For long term potential I quite like Lloyds. Could well be back 100% privately owned in a couple of months or so. However, right now off the 2 hourly chart that’s a clear impulsive move down from the 71.05 high. So it ought to post a top side correction and then as a minimum make a further five wave decline to the downside’.
I particularly like the clarity and colours in his charts. The conventional black and white candles as opposed to the horrid red and green ones adopted from the stockbroking community. The alternating pale grey and white bands in the background marking out the days on the hourly time frames. The fact that only relevant analysis to the current issue is displayed, rather than all the workings that some people throw in for good measure.
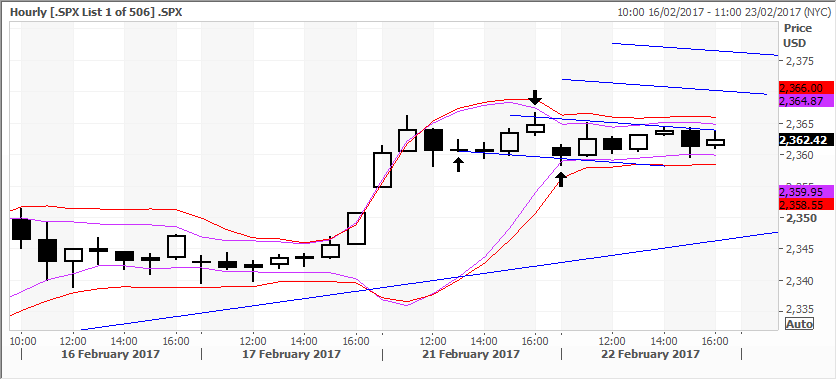
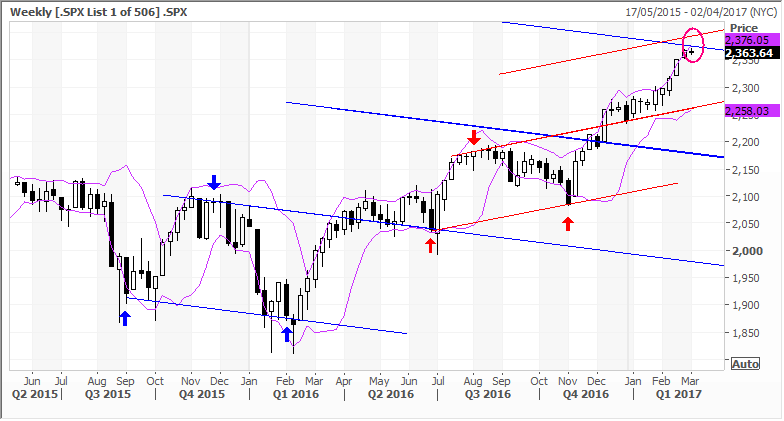
In his words: ‘I have a very sophisticated timing model I’ve evolved and, for 5, 8 and 13 day time frames it’s sounding all the sirens and flashing red lights regarding a major top [for the S&P 500]. I look for confirmation by way of excess in the one and two day timeframes. I’m reluctant to pull the trigger at this point. I haven’t just put this together I’ve been running with the blue energy channels [on the weekly S&P chart] for about a year now. OK, we’re within a smidgen of hitting the second blue channel up target. The euphoria likely takes us up to the first red channel target. This is where the odds are very high indeed that the bulls have become exhausted, no more buyers, at least for now. I strongly suspect the appearance of a strong black candle on the weekly chart will cause a panic. Expect a pullback onto that middle red channel line before the final topside move unfurls. After that, “Tin helmets on, last person out please turn out the lights!” and we’re on our way to 650 for the S&P 500’.
Perhaps the Snapchat IPO might be yet another warning to add to his armoury.
Tags: Channels, energy, exhaustion, parallel
The views and opinions expressed on the STA’s blog do not necessarily represent those of the Society of Technical Analysts (the “STA”), or of any officer, director or member of the STA. The STA makes no representations as to the accuracy, completeness, or reliability of any information on the blog or found by following any link on blog, and none of the STA, STA Administrative Services or any current or past executive board members are liable for any errors, omissions, or delays in this information or any losses, injuries, or damages arising from its display or use. None of the information on the STA’s blog constitutes investment advice.


Latest Comments