


A sense of perspective: How much does one need
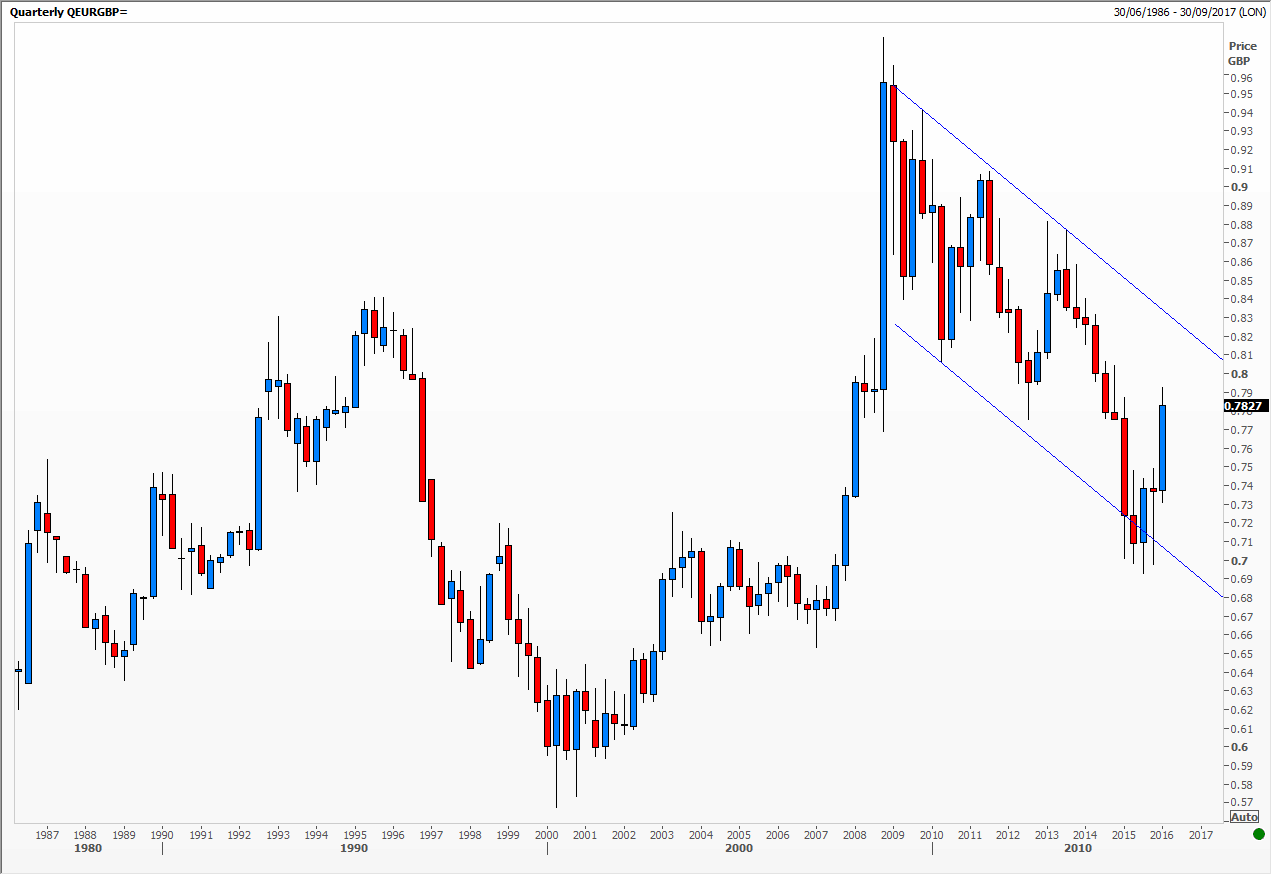
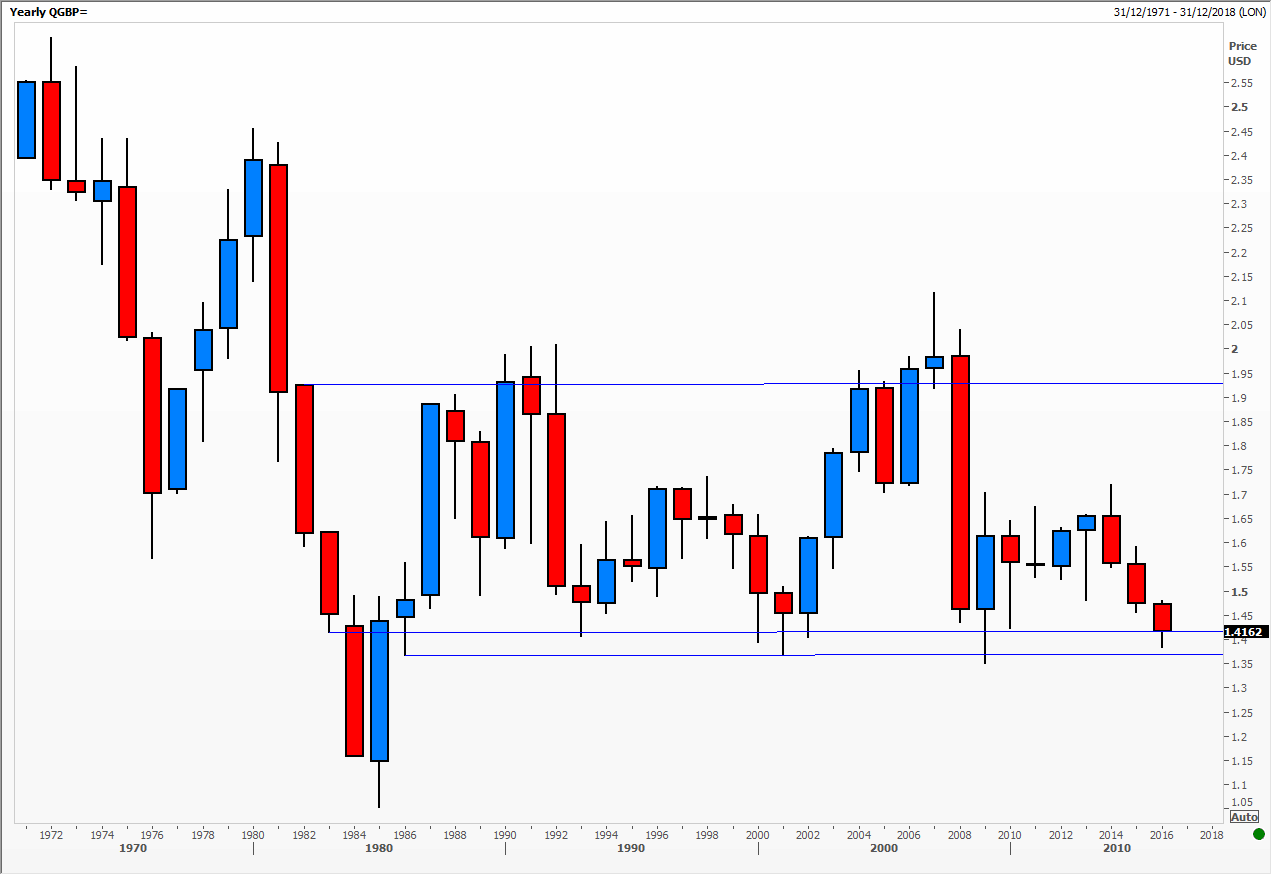
Looking at the beautiful photos taken by British astronaut Tim Peake from the International Space Station reminded me of how important distance and familiarity are to technical analysis. When charting a new market or instrument I always insist on starting with the very longest time series  available. In the charts below you will see that I have data for euro/sterling going back to 1987 and for Cable starting in 1971.
From there I begin by marking the salient features, zooming in in stages, adding analysis as appropriate and generally familiarising myself with the ways the instrument moves and reacts. The final step is of course coming to a decision as to future trends, patterns and cycles the chart is likely to map out. Obviously my forecast time horizon must be appropriate to the client’s needs.
However some shares have very short price histories and Initial Public Offerings (IPO) have none at all. With the latter one can only watch and wait until the market settles down, keeping in mind that new shares are more often than not sold at a discount; the last thing the issuer wants is a flop and stock on his books. Charts with relatively little data I treat with a great deal of caution and warn that this is the case when writing up my analysis.
As we all know, the euro started trading in 1999 at a fixed rate of 1.95583 Deutschemarks. So where exactly has previous data against the pound come from? Ask questions and make sure you know exactly; don’t take anyone else’s word for it. Reuters uses the German unit as proxy but other charting systems use either the ECU or a basket of currencies. Make sure you know what you are working with and what are the implications.
As for Cable, one wonders whether pre-1980’s data is worth even looking at; Britain has changed so much since then, and so has the foreign exchange market. This is especially relevant to emerging market currencies where regimes and policy changes adapted by successive governments may have fundamentally changed the relationship between FX values.
Tags: data history, Foreign exchange, perspective
The views and opinions expressed on the STA’s blog do not necessarily represent those of the Society of Technical Analysts (the “STA”), or of any officer, director or member of the STA. The STA makes no representations as to the accuracy, completeness, or reliability of any information on the blog or found by following any link on blog, and none of the STA, STA Administrative Services or any current or past executive board members are liable for any errors, omissions, or delays in this information or any losses, injuries, or damages arising from its display or use. None of the information on the STA’s blog constitutes investment advice.


Latest Comments