


Platinum’s parabolic curve: Time to stop and reverse?
All technical analysts have their favourite ways of drawing charts and the indicators and oscillators they find the most useful; that’s only normal. The trouble for those new to the discipline is that the same old charts, on the same markets, using the same tools tend to appear repeatedly. This clustering becomes chicken and egg, with analysts tending towards methods they think everyone else likes, and readers believing this is the only way of doing things professionally.
Pity really, because thus some tools fall out of favour and are seen as obsolete, ineffective and, worse still, are forgotten. This was the case with Elliott Wave theory until Robert Prechter came along, and some would say is the case today with Gann Theory – Tony Plummer excepted.
A system I use daily, though tend not to write it up in my analytical notes, is the Parabolic SAR (stop and reverse). Developed by the talented J. Welles Wilder (he of RSI fame), it’s a trend following system which reacts more quickly than moving averages do – even the very short-dated ones. Like the crossover signals, the SAR keeps one continuously in the market, either long or short, which can be very expensive when trends fade.
As well as giving buy signals when the plotted dots (one per time period) switch from above to below the price, and vice versa for sell signals, the dots serve to suggest where trailing stops ought to be placed. As the trend becomes more established, the dots accelerate to catch up with the market thus limiting drawdowns. This is especially useful in very dynamic financial instruments. The default parameters are: start acceleration: 0.02, acceleration increment 0.02, maximum acceleration 0.2.
To illustrate the method, I’ve chosen daily and weekly charts of spot platinum, which has been on a rip for the last three years or so. For comparison, I’ve added daily spot gold, which has alternated between trending and sideways action. It’s also lagged badly because in 2016 one needed 47.5 ounces of platinum to buy one of gold; today the ratio is just 1.13.
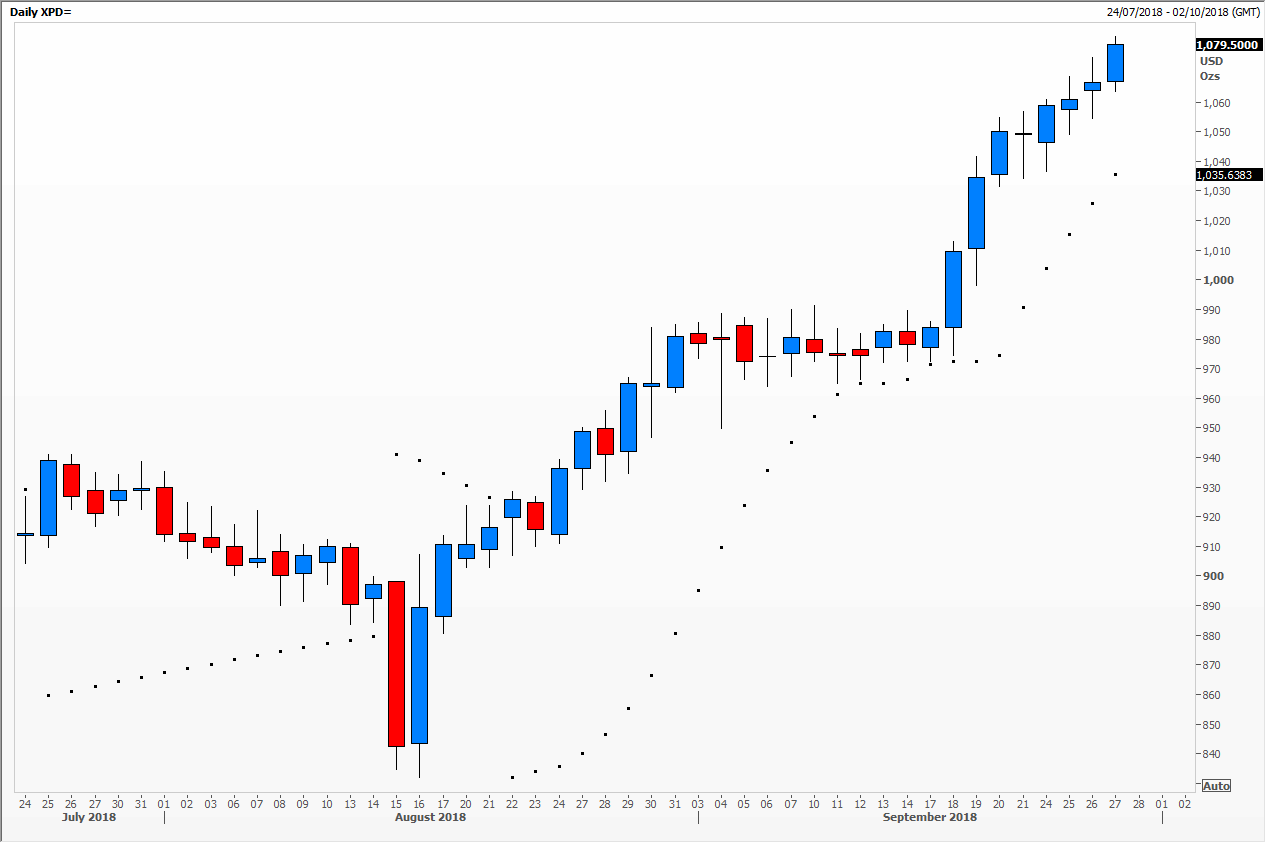
Platinum1
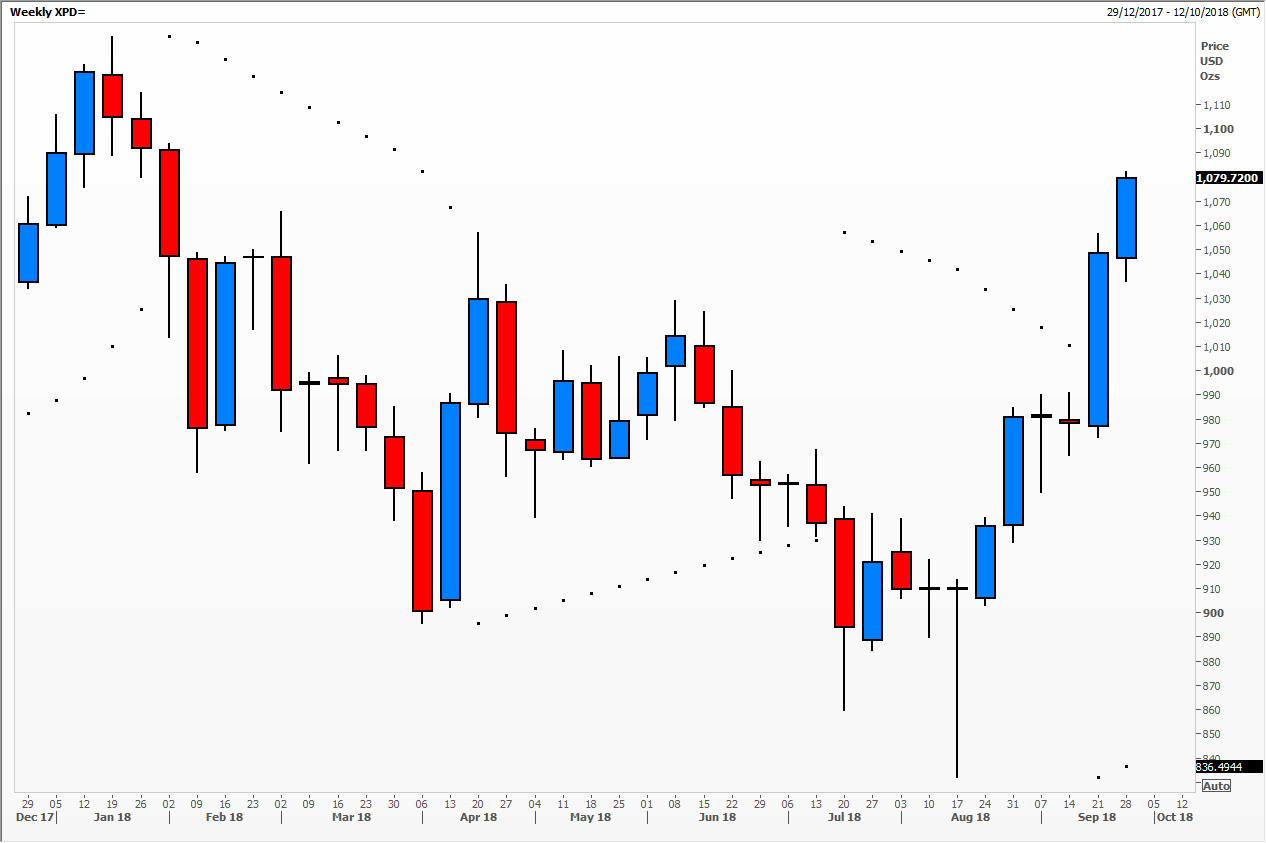
Platinum2
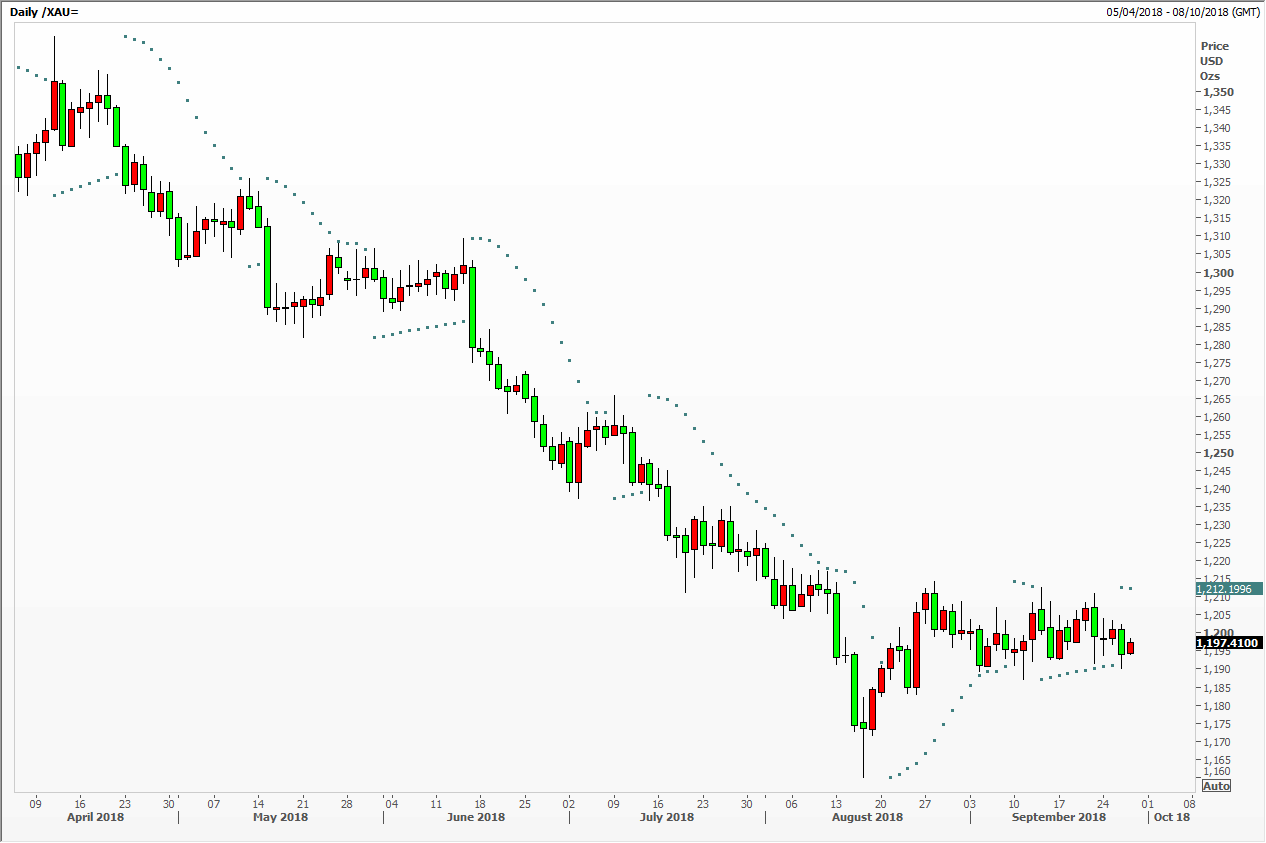
Gold
Tags: gold, Parabolic SAR, Platinum, stops
The views and opinions expressed on the STA’s blog do not necessarily represent those of the Society of Technical Analysts (the “STA”), or of any officer, director or member of the STA. The STA makes no representations as to the accuracy, completeness, or reliability of any information on the blog or found by following any link on blog, and none of the STA, STA Administrative Services or any current or past executive board members are liable for any errors, omissions, or delays in this information or any losses, injuries, or damages arising from its display or use. None of the information on the STA’s blog constitutes investment advice.


Latest Comments