


Market reaction to US June non-farm payroll data: Released Friday 2nd July 12:30 GMT
For some years now US employment data, released on the first Friday of the month, has been the most closely watched – and speculated on – economic release; this wasn’t always the case. I remember when it was Thursday’s weekly money supply and before that the monthly trade balance (read deficit). The overnight session of the CME’s S&P E-Mini futures contract saw prices hovering in a small range, on low volume, either side of 4314, as seen in this 5-minute candle chart.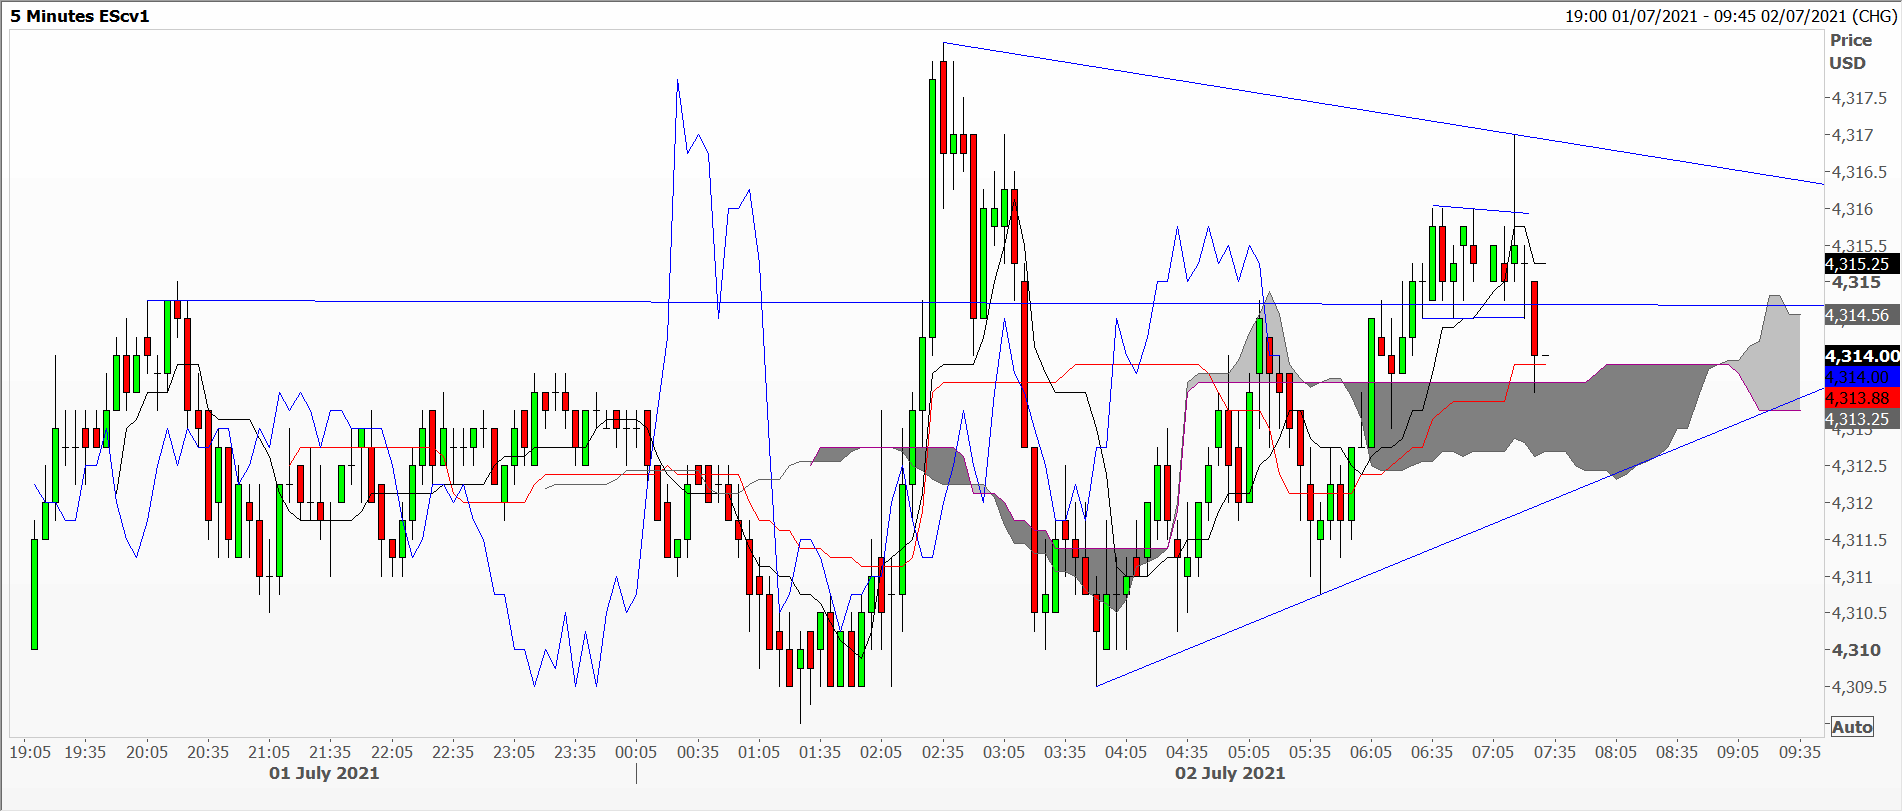
The actual figure is less important than how the guesstimates being bandied about ahead of the release compare to reality. This month had most analysts clustering around an increase of about 700,000 jobs; reality was in that in June a better than expected 850,000 jobs were created. When expectations vary considerably, the impact is more muted. Then look for revisions to previous data, in this case May saw 583,000 jobs created rather than the 559,000 originally reported. On the other hand unemployment rose to 5.9% from 5.8%, and U2 underemployment from 9.8% to 10.2%. A mixed bag, I think you’ll agree.
The market reacted to the good news bursting higher from Ichimoku cloud support to form, with a big bullish Marabuzo, the pole of a pennant one hour later. 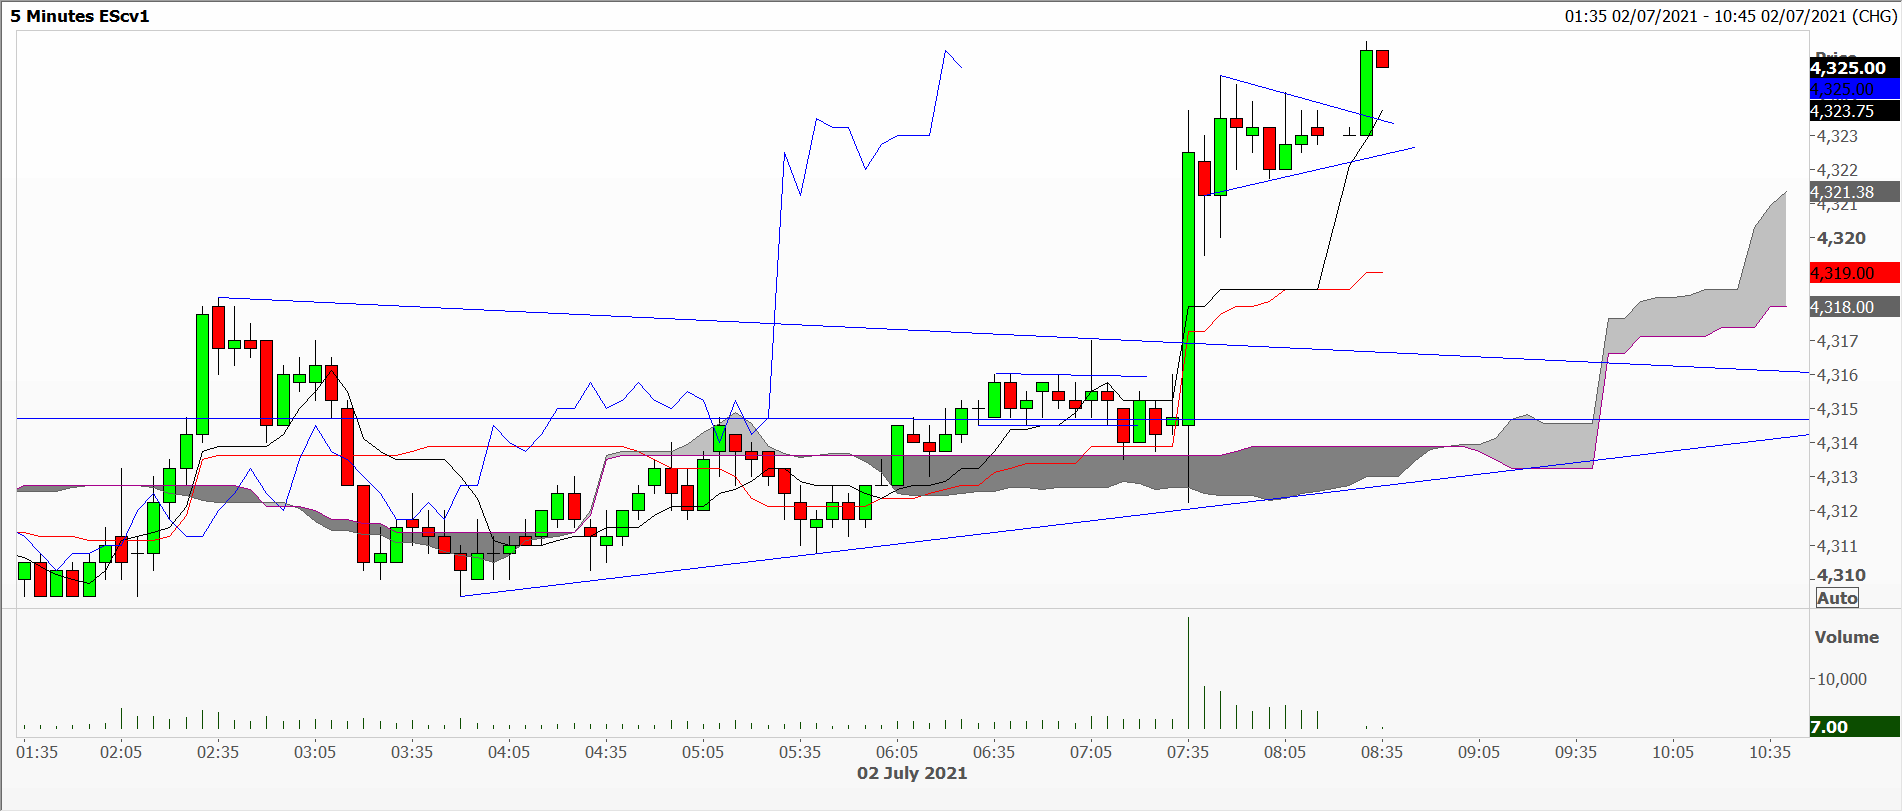 Volume immediately fell back during its triangle, probably caused by those packing up early for the long weekend to commemorate the 4th of July US holiday. I should also add that there was a reported ransom ware attack on an estimated 200 US businesses that same afternoon.
Nevertheless, at the close of US business the futures market managed to close at a new record high, the S&P 500 index for a 7th consecutive record close, the first time since 1997; remember the Rule of 8-10. The daily picture shows an overbought market based on the RSI, trading above the top of the Bollinger band, with low historical volatility and the VIX index its lowest since February because the market has been moving steadily in one direction. Careful.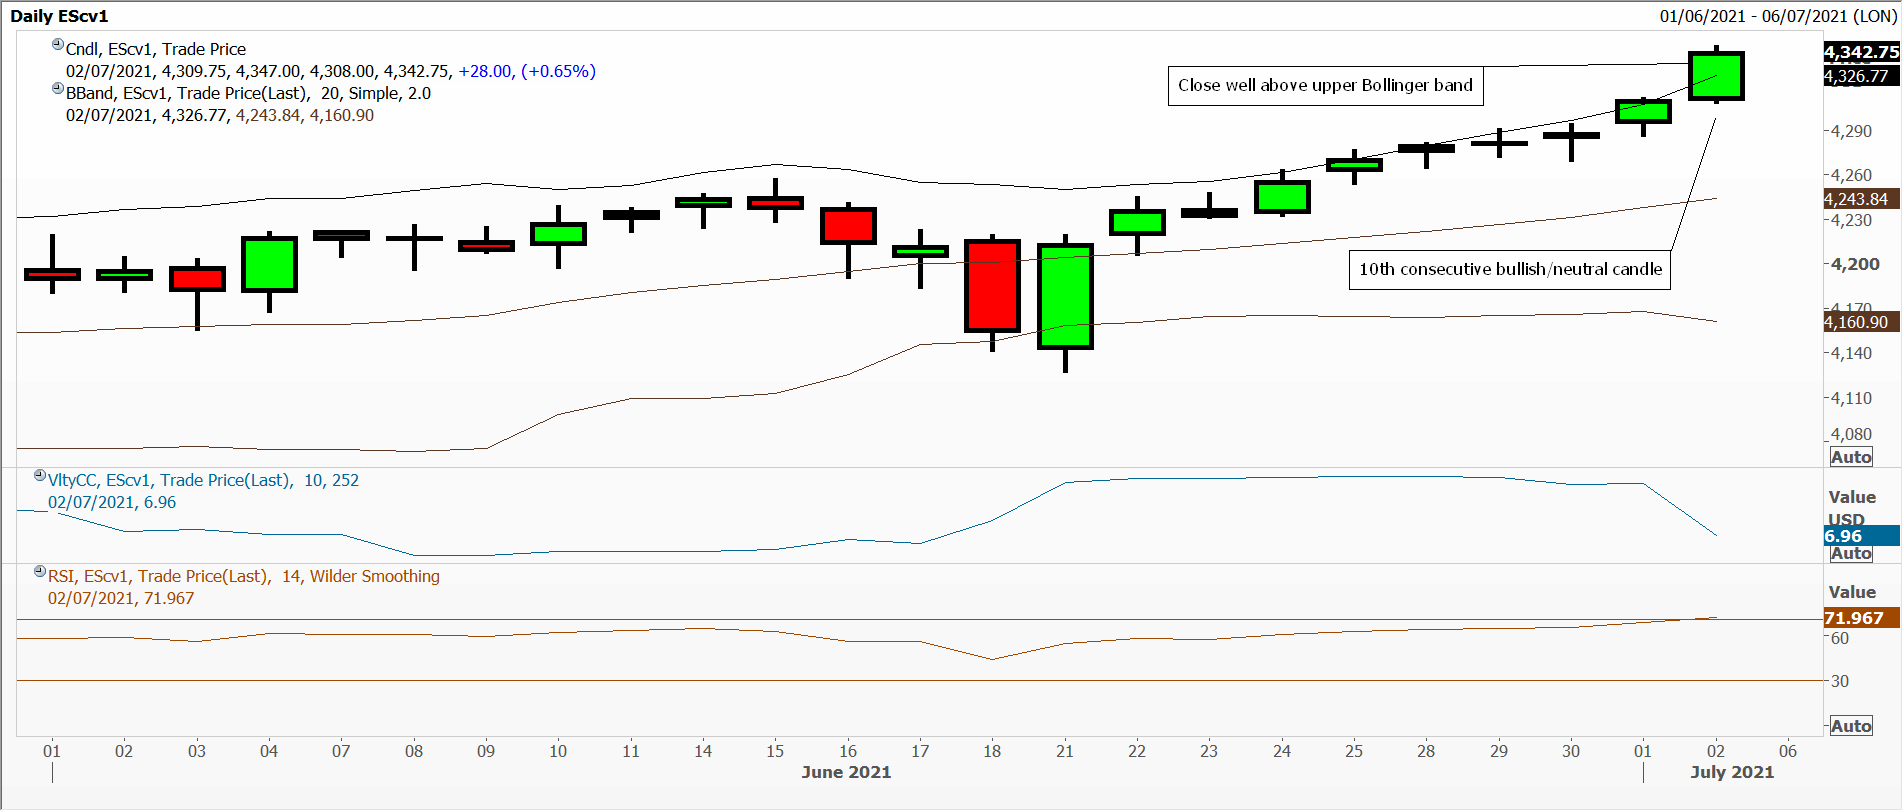
Tags: 5 minute charts, daily and weekly closes, Economic data
The views and opinions expressed on the STA’s blog do not necessarily represent those of the Society of Technical Analysts (the “STA”), or of any officer, director or member of the STA. The STA makes no representations as to the accuracy, completeness, or reliability of any information on the blog or found by following any link on blog, and none of the STA, STA Administrative Services or any current or past executive board members are liable for any errors, omissions, or delays in this information or any losses, injuries, or damages arising from its display or use. None of the information on the STA’s blog constitutes investment advice.


Latest Comments