


‘The Case for 2021 Harnessing Super Long Term Cycles to Gain a Competitive Advantage’: A presentation by Andrew Pancholi for IFTA
The evening of Tuesday the 29th June 2021 will go down in the annals of English history. Not only were the Duke and Duchess of Cambridge at Wembley, but eldest son George was dressed as a mini-me of his Dad, in blazer, formal shirt and striped tie.
I, on the other hand, chose to watch the International Federation of Technical Analysts’ video presentation of the [not so] catchy title above – seeing as I’m neither a football fan nor especially patriotic. I’m glad I did as I’ve subsequently had wall-to-wall media coverage of the game and its protagonists. For IFTA associated members the presentation will be available on video shortly; I urge you to watch it.
UK-based Andy Pancholi was introduced by Ron William, and a very slick duo they made with excellent slides, loads of interesting data, and a seriously long-term outlook – which has become increasingly rare these
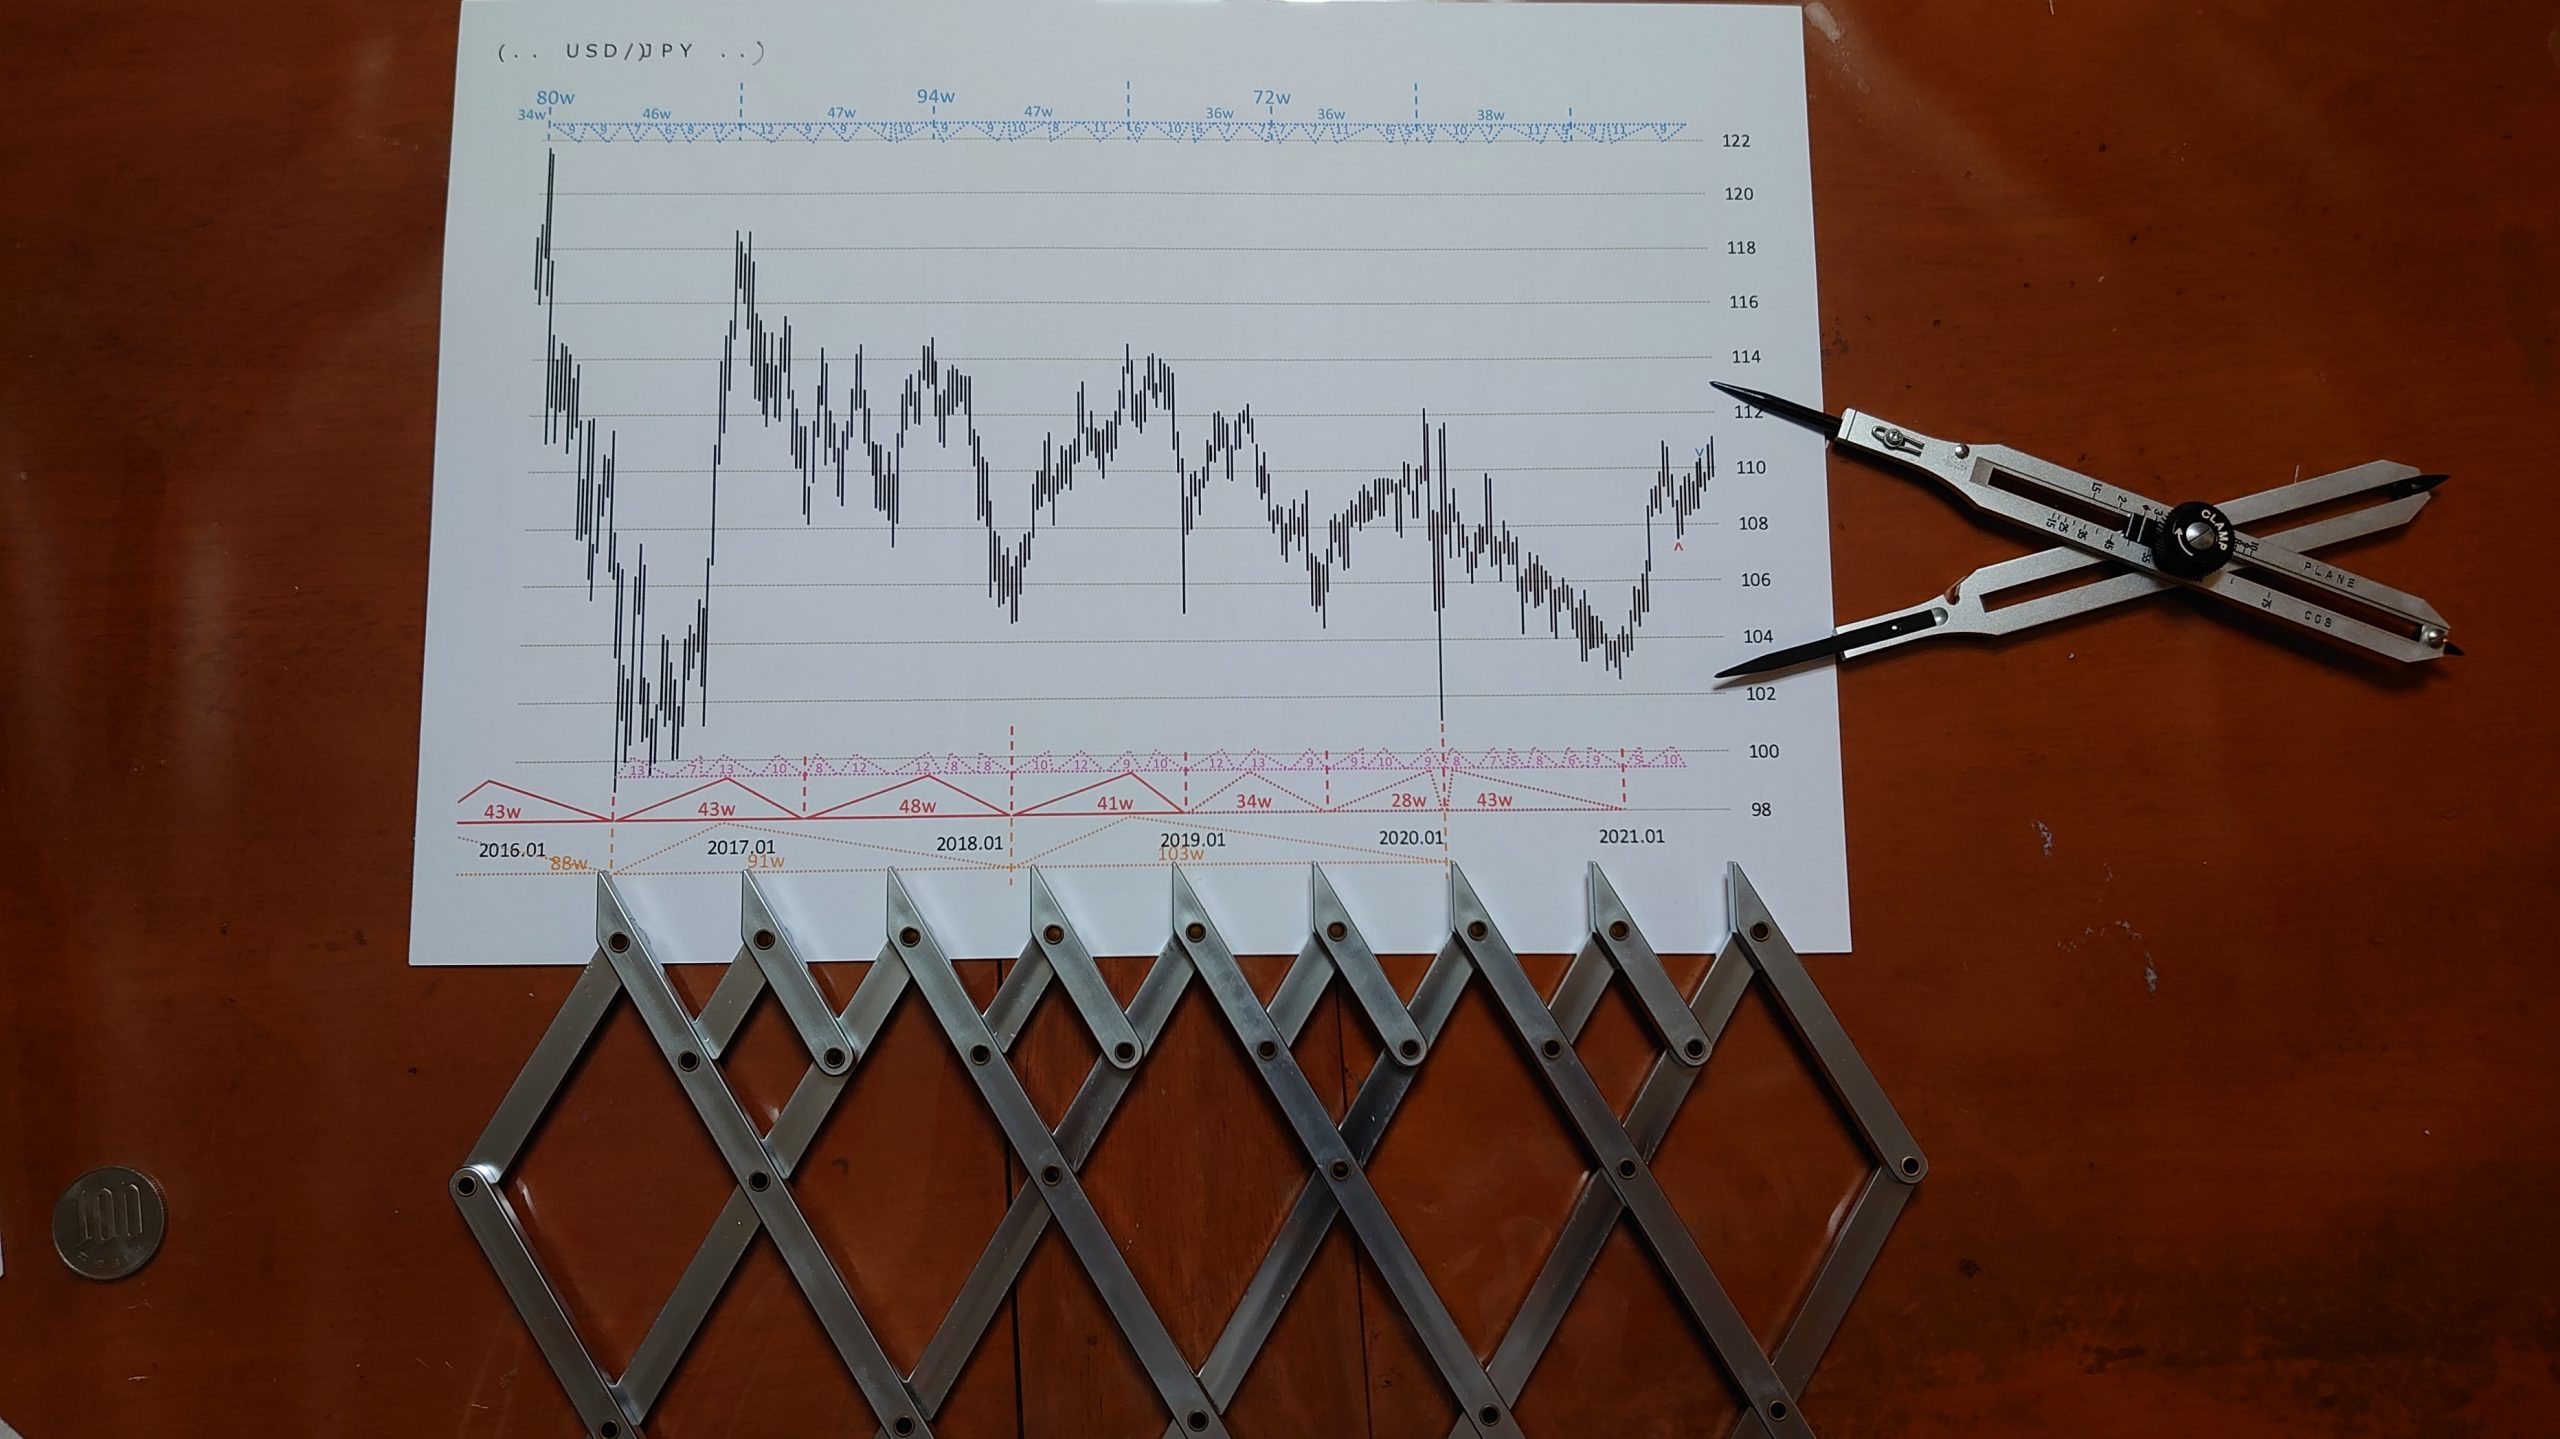
Old-school cycle measurement courtesy of Yoshinobu Sakai MFTA
days. Creator of www.markettimingreport.com and contributor to www.cycles.org the latter in a not-for-profit established in 1941 to encourage research into climatology and other recurring global events.
He outlined something he calls the pandemic cycle, starting with smallpox in 1681 which wiped out much of the Americas first people, measles in 1717, cholera in 1817 and influenza in 1918 – and now Covid-19. These are [almost] 100-year cycles. Then there is the 45-50-year one, and the 10-year one where there is a tendency to higher or lower financial values depending on the last digit of the year; years ending in 1 are often associated with conflict. You have been warned.
He adds a lot of historical detail for context, including the use and abandonment of the gold standard, floating exchange rates and financial innovation.
As well as favouring the Andrews Pitchfork and Commitment of Traders’ Report, under the bar charts he adds a histogram. This is not volume (as we have been trained to expect). It is based on the confluence of cycles on that day, plotted ahead of price as well as with it. It’s the first time I’ve seen this and it’s an excellent way to deal with the many major and minor cycles involved.
Appointment to view this interesting and engaging speaker.
Tags: Andrews Pitchfork, cycles, gold, Market timing
The views and opinions expressed on the STA’s blog do not necessarily represent those of the Society of Technical Analysts (the “STA”), or of any officer, director or member of the STA. The STA makes no representations as to the accuracy, completeness, or reliability of any information on the blog or found by following any link on blog, and none of the STA, STA Administrative Services or any current or past executive board members are liable for any errors, omissions, or delays in this information or any losses, injuries, or damages arising from its display or use. None of the information on the STA’s blog constitutes investment advice.


Latest Comments