


Trend following Wilder’s RSI trendline breaks
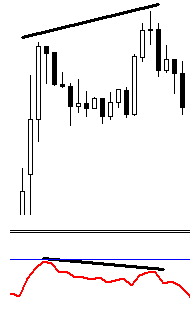
Since my last blog post regarding Fibonacci Extensions for profit targets, I have received some great feedback, so I would like to say thank you to everyone who took the time to read it. In this post I will be discussing something I use for longer term analysis. Wilder’s RSI is a widely used tool in technical analysis and mostly used for overbought and oversold areas in the market. Although I do believe this can be useful, I believe there is a different way to try and follow a trend longer term rather than look for mean reversion trades. One thing I noticed over time was that when markets consolidate after a long rally the oscillators start to diverge away from price, i.e. prices make higher highs and the indicator makes a lower high (Divergence).
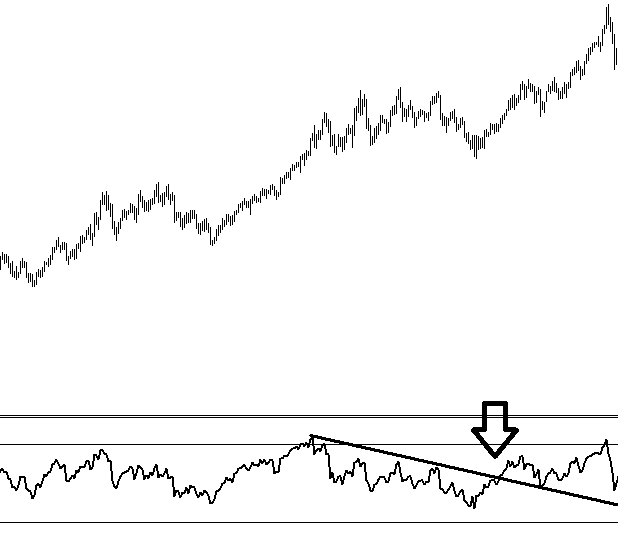
Now this consolidation can be the start of range bound conditions, a reversal or can be the market pausing before a rally higher into a higher price value.
Interestingly enough many traders will look for a short mean reversion trade at this time. But as a trend follower I am looking for a signal to see when the trend is going to continue to higher prices and how I will look for an entry point in this long trade. The RSI downward trend line then breaks to the upside at the arrow in the chart and the consolidation range is also broken to a higher area. I tend to use this technique on equities that trend over a long period of time to find optimised entry points, again this is only one tool in a trader’s toolbox and I do confirm these trades by adding other techniques for confluence but I hope you find this article insightful.
Kind regards
Rajan Dhall MSTA
This is how I am looking to use the RSI to enter a long trade in the direction of the trend. A RSI trend line can be added where the price consolidation begins and the indicator begins to make lower highs even as the price continues to make higher highs. The trend line has to be added at the top of the lower highs just as a downward trend line would be added on price action.
Tags: relative strength, RSI, Stock market, volatility
The views and opinions expressed on the STA’s blog do not necessarily represent those of the Society of Technical Analysts (the “STA”), or of any officer, director or member of the STA. The STA makes no representations as to the accuracy, completeness, or reliability of any information on the blog or found by following any link on blog, and none of the STA, STA Administrative Services or any current or past executive board members are liable for any errors, omissions, or delays in this information or any losses, injuries, or damages arising from its display or use. None of the information on the STA’s blog constitutes investment advice.


Latest Comments