


FTSE’s 6,000 line has been respected by the market yet again!
On 18th February, on behalf of the Society of Technical Analysts, I presented the inaugural Finance Society lecture at Anglia Ruskin University’s Lord Ashcroft International Business School and showed the following chart.
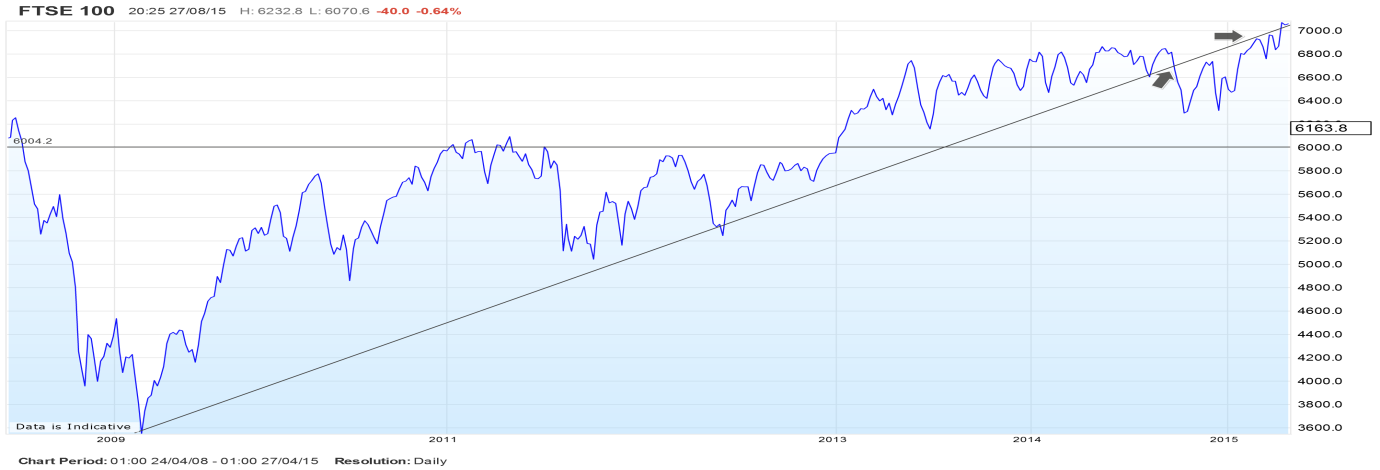
Chart 1
I argued that before making significant new highs the FTSE 100 would return to the important 6,000 line and it would then give a significant Coppock indicator buy signal, which will be only the eighth Coppock buy signal in the FTSE 100’s 32 year history. (For more information on Coppock refer to (http://en.wikipedia.org/wiki/Coppock_curve). So let’s ask the following questions;
1. Why was the FTSE 100 likely to fall approxmiately 15% back to 6,000?
Answers:
- The bull market uptrend from March 2009 had been broken in late 2014 (see the first arrow in Chart 1). That would not have been a problem if, during the seasonally strongest part of the year (late-October to May) the market had broken back above the uptrend and continued the bull market above the line. But (see the second arrow) it was failing to do so
- History was also telling me that this bull market duration was now longer than average and that I should be on alert for a correction.
2. Why should it find support at the 6,000 level?
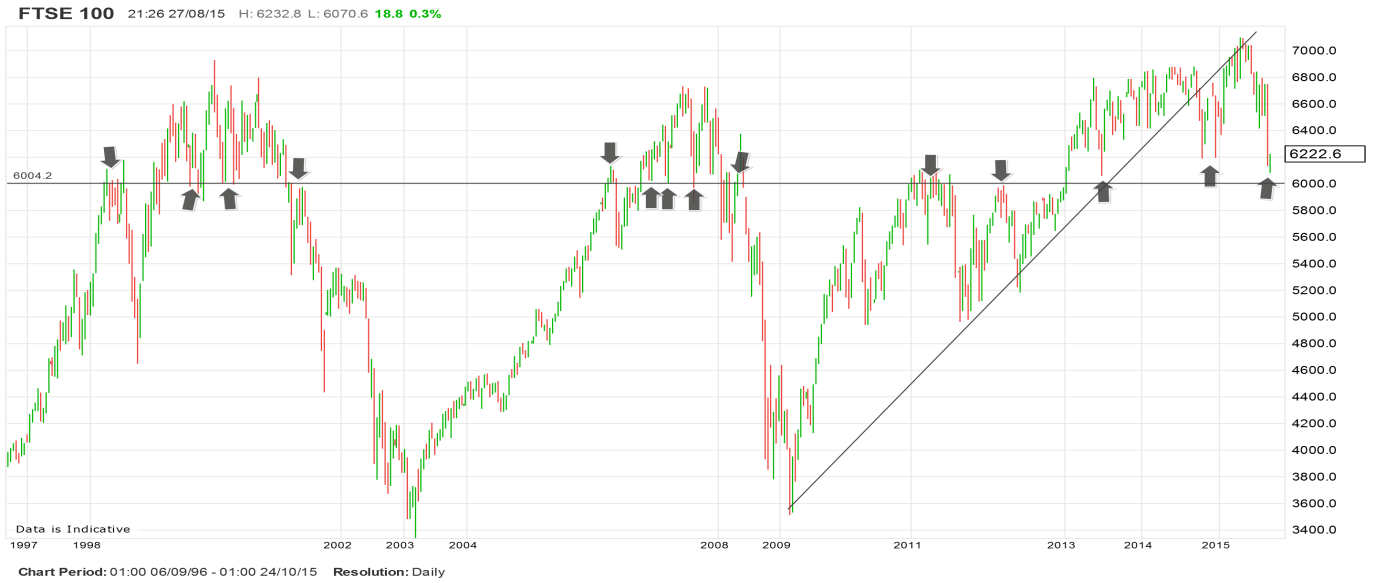
Chart 2
Answers:-
- I have purposefully used a candle chart, as it shows better intra-period detail. Since April 1998 (17.4 years) FTSE’s 6,000 line has been used multiple times by the market as support and resistance (the arrows show this, with the last arrow showing August 2015) and I have often used the way FTSE interacts with the 6,000 line to help me determine the market’s bullish or bearish psychology.
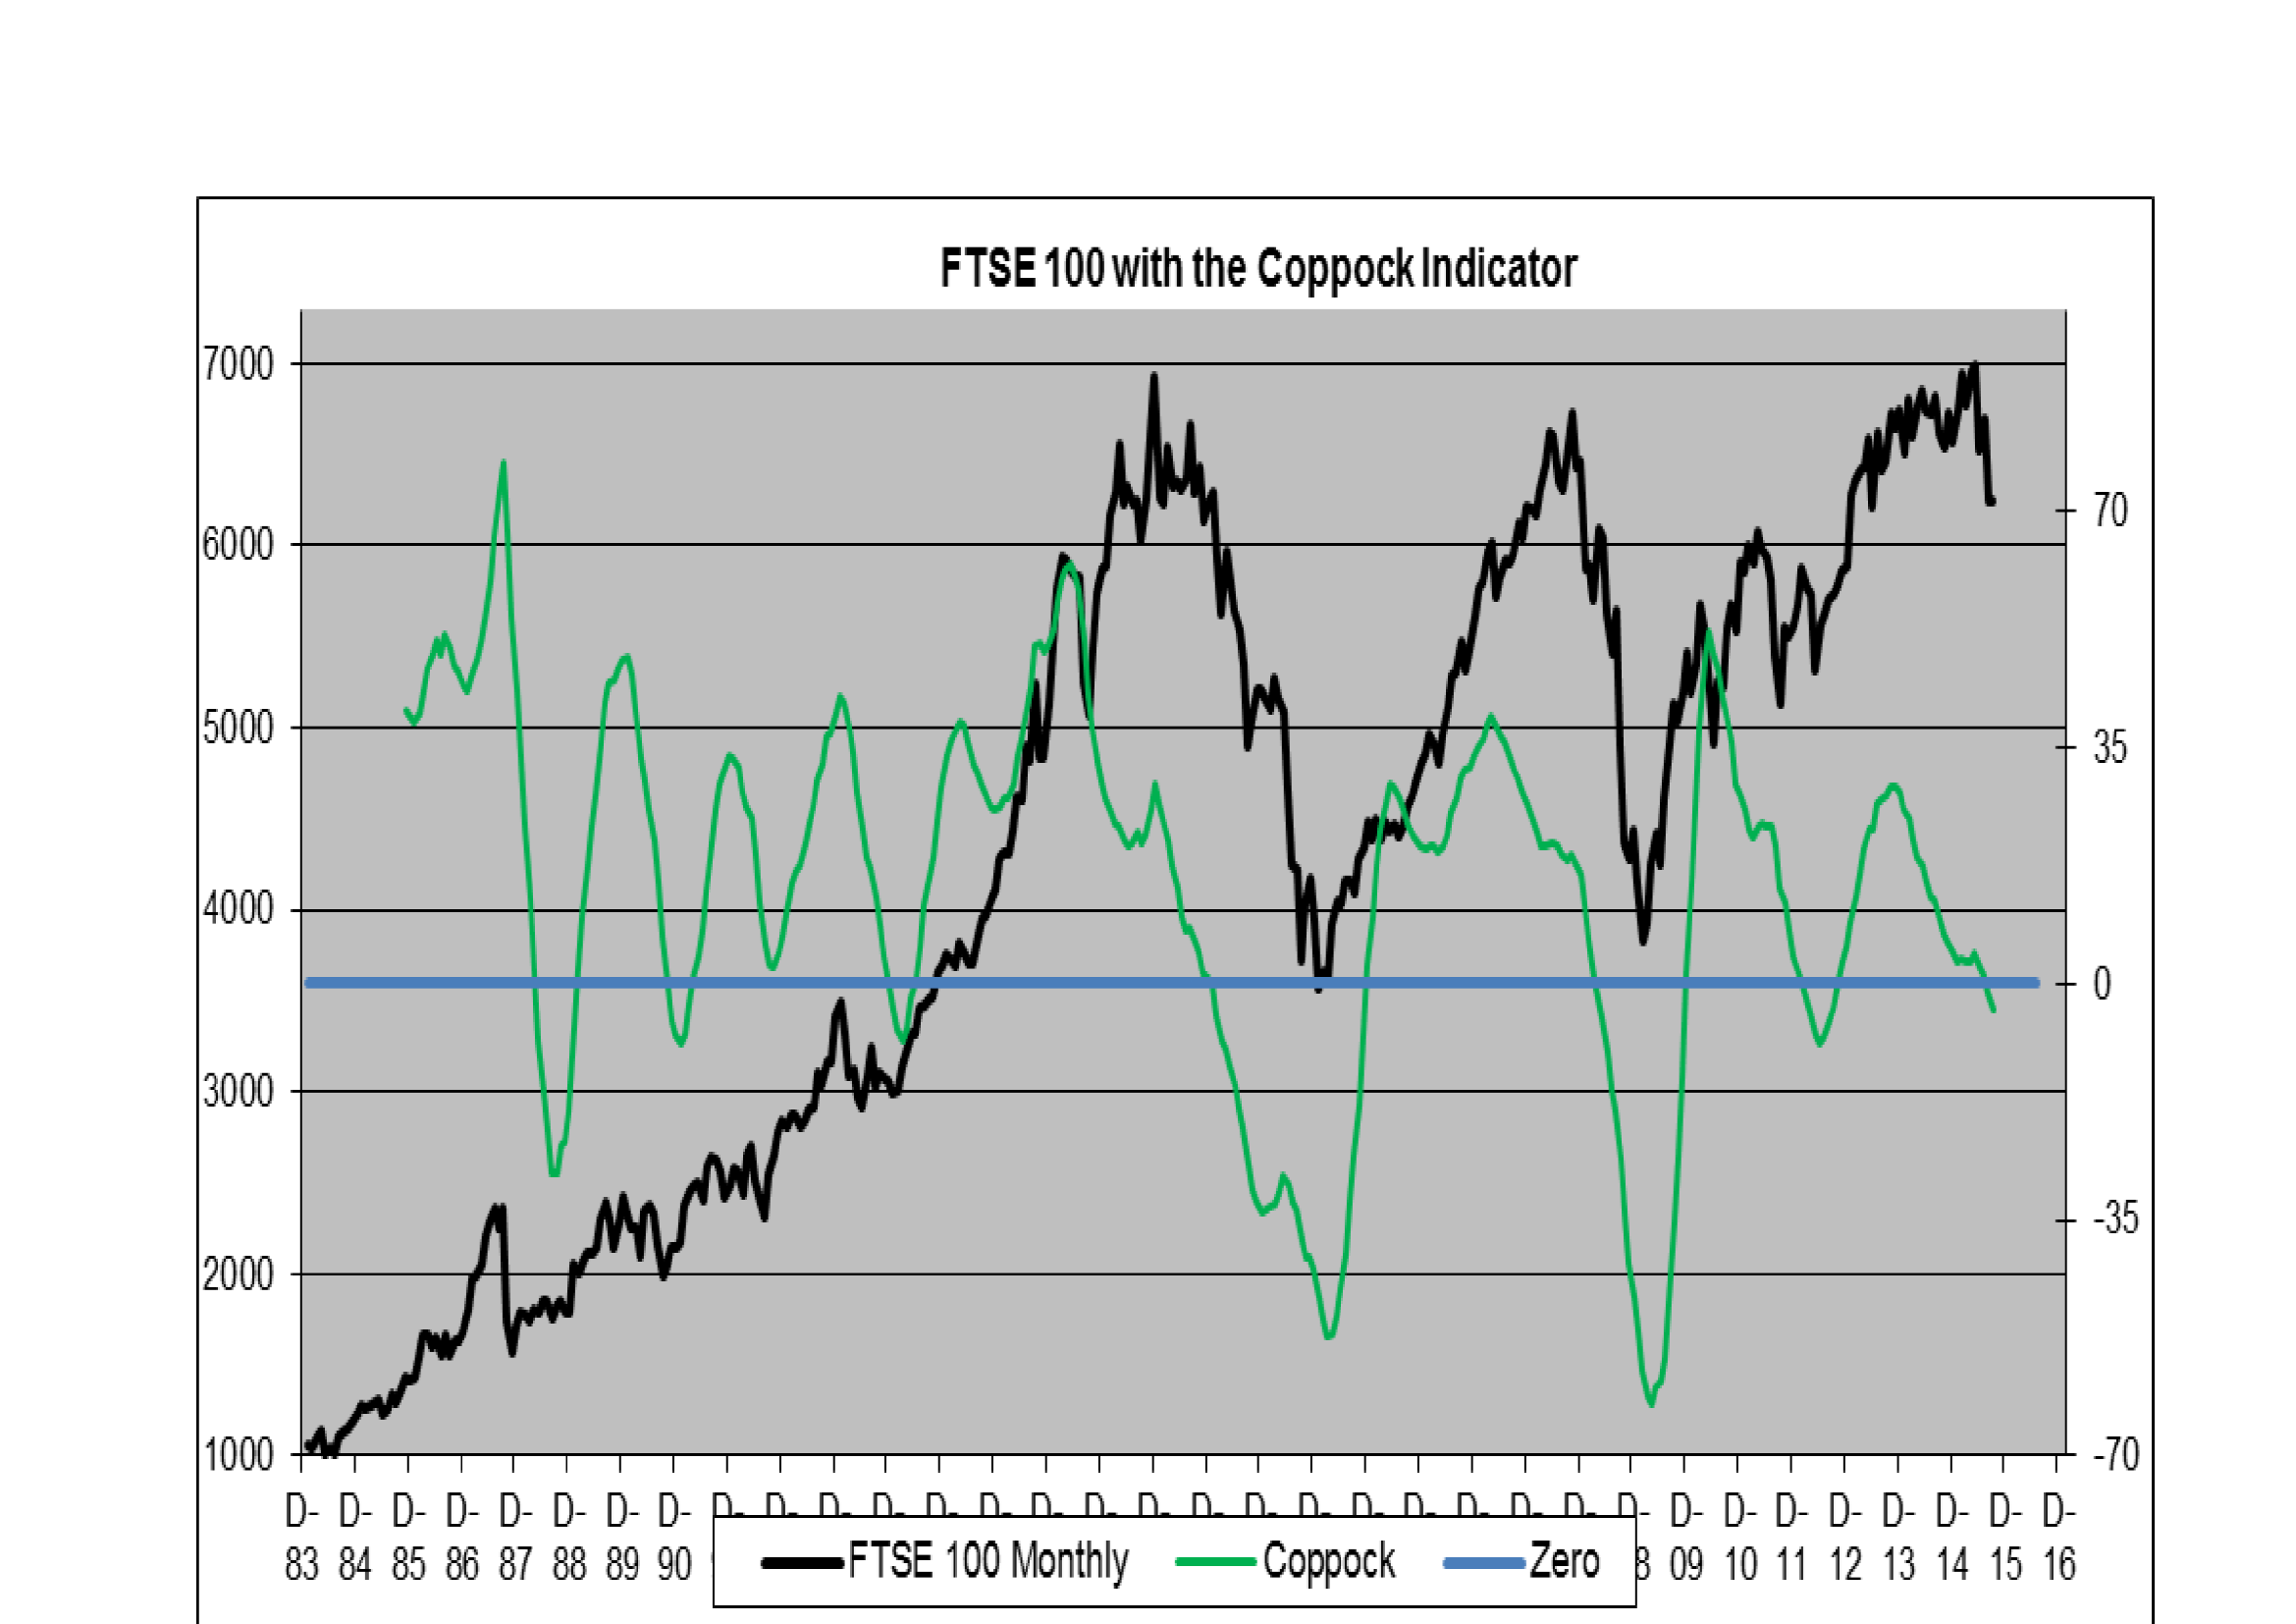
- Early this year I had been analysing the monthly Coppock indicator and had calculated that a fall by FTSE to 6,000 in the weakest seasonal part of the year (May to late-October) would give warning of a future buy signal. At 31st August the Coppock indicator (see Chart 3) confirmed that there will indeed be a Coppock buy signal, which will be confirmed probably in early 2016 (when I expect the green Coppock indicator line to register a less negative number). I will discuss the Coppock indicator in more detail in further blogs. (Note: I have back-tested the Coppock indicator and to date it has a 85% success ratio on FTSE on the buy side – I find it a reliable signal, unfortunately you only see these signals on average every 4 years and there have not been enough signals to build a database for further empirical evidence. It is also worth noting that it works better on large diverse indices than it does on individual stocks.)
- I currently believe that given the importance of the 6,000 level as a pivotal point, and the fact that the Coppock indicator is likely to give a buy signal somewhere within the region of 6,000 it is reasonable to assume that the 6,000 level on FTSE can be used as a solid support line. Again, I will discuss this in further blogs.
In summary, my analysis has combined Charting, Technical Analysis and Behavioural Finance culminating with my conclusion that the FTSE 100 index will find support at or near the important 6,000 level before rising again to the old highs in 2016. But, please be warned that September and October are notorious for being bearish months – although I have reasons why I believe 6,000 will be a solid support line again all I know for certain is that the excellent monthly Coppock indicator will definitely now give a buy signal at some point in the future, but it is possible that it may be from much lower levels. So, remember your money management discipline and, as I’m sure you always do, keep your stop-losses in place. Good luck.
Simon Warren MSTA
The views and opinions expressed on the STA’s blog do not necessarily represent those of the Society of Technical Analysts (the “STA”), or of any officer, director or member of the STA. The STA makes no representations as to the accuracy, completeness, or reliability of any information on the blog or found by following any link on blog, and none of the STA, STA Administrative Services or any current or past executive board members are liable for any errors, omissions, or delays in this information or any losses, injuries, or damages arising from its display or use. None of the information on the STA’s blog constitutes investment advice.


Latest Comments