


Using Fibs for profit targets
First of all I would like to say I hope I can do the blog justice in Nicole Elliott’s absence as I have immensely enjoyed her posts so far, secondly I wanted to post something in this blog that I use day to day as an intraday futures trader that I learned on my journey as a technical analyst. Many new traders come to join the STA and maybe gloss over the relevance of some of the techniques taught or forget them over time. The one I will be discussing today is a great way to determine profit targets in short term trading.
I use Fibonacci on a daily basis while day trading to identify trades, sometimes in confluence but most of the time in profit management. What I will do today is explain a very powerful way which has helped me enhance my returns by judging risk to reward. I will assume people reading this blog have a fair idea of the principles of Fibonacci, so I won’t explain the principles of the tools (explanation). The one thing I favour for this technique is the Fibonacci extension.
Now the Fibonacci retracement tool is used for measuring the retracements of a move in price action from top to bottom or bottom to top (swing high to swing low or vice a versa), I will be using the tool to measure individual waves within longer swings for short term targets. See example below.
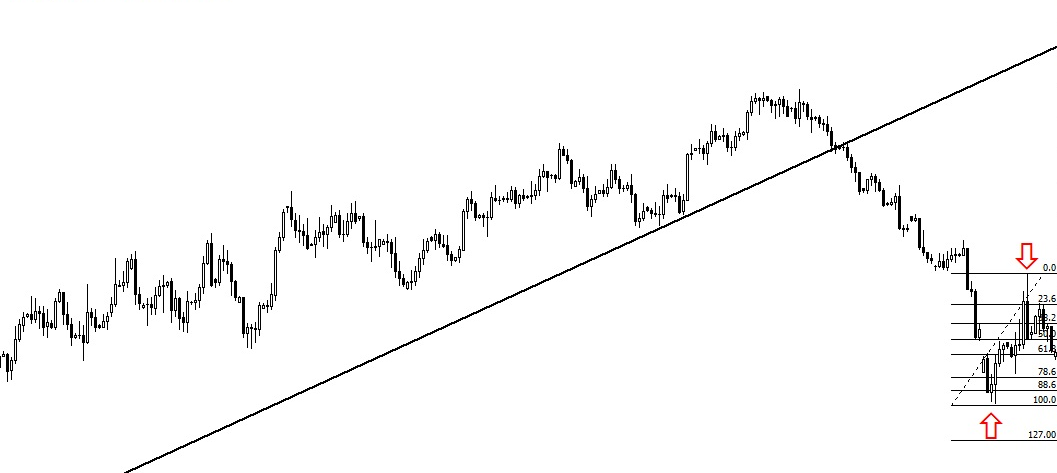
I use the Fibonacci extension tool in the following way: I look for a simple trend line break and minor consolidation in price. Once this consolidation has occurred I place the Fibonacci tool from the lowest point of the small pullback wave to the highest point of the wave. This then gives me targets below, which plot Fibonacci extension numbers of 127.0, 161.8, 200.0, 261.8 etc. It is these numbers I will use for my profit targets once the 100.0 Fibonacci level is broken to the downside.
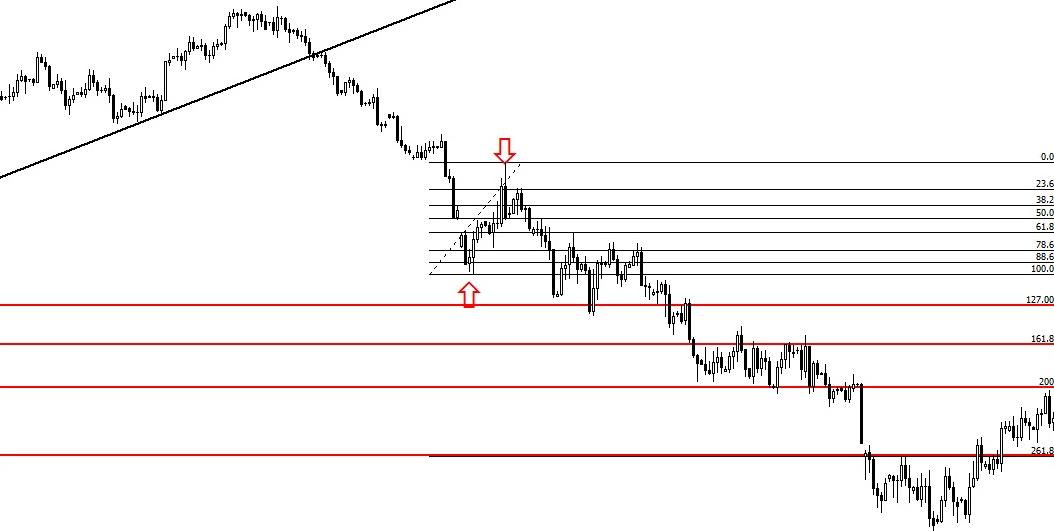
As you can see the Fibonacci extension levels in the above example acted as minor support levels, and as the events unfolded at each Fibonacci level there was a minor pullback. I marked the extension levels with red support lines to make things clearer, but you can clearly see from the price action the targets were in this case sensible in relation to the risk, which in this trade would be at the top of the consolidation marked by the top red arrow. Now as the Fibonacci extension levels get broken to the downside, I would then look to either take profits from the trade or trail the stop loss to minimise risk.
I hope this gives you small insight into how I use the technical analysis tools on a day to day basis. However I must stress I do not only use the break of the 100.0 Fibonacci extension level as confirmation of entry into a trade but this blog post is only touching on the subject of profit management.
I sincerely hope this blog post has been helpful and would welcome any comments.
Rajan Dhall
For further reading on Fibonacci we recommend the following book by Carolyn Boroden: Fibonacci Trading – how to master the time and price advantage
This is available in our STA library at the Barbican.
If you want to learn more about Fibonacci and its application in technical analysis, this is covered in our Part 1 Diploma course which will be starting in October 2015 – Details here
Tags: Fibonacci, Ratios, Stock market, trending
The views and opinions expressed on the STA’s blog do not necessarily represent those of the Society of Technical Analysts (the “STA”), or of any officer, director or member of the STA. The STA makes no representations as to the accuracy, completeness, or reliability of any information on the blog or found by following any link on blog, and none of the STA, STA Administrative Services or any current or past executive board members are liable for any errors, omissions, or delays in this information or any losses, injuries, or damages arising from its display or use. None of the information on the STA’s blog constitutes investment advice.


Latest Comments