


Too many moving averages? And many moving parts
A long, long, time ago, I can still remember – when moving averages were plain and simple. Nothing weighted or exponential, dynamic or otherwise (nowadays considered moribund perhaps). Traders used to use 10 and 20 day moving average crossovers to generate buy and sell signals; fund managers, who had time on their side, opted for 50 and 200 day ones, again only crossovers.
But the traders got bored and tetchy while waiting for averages to cross and decided they could do better; enter the closing price against one or maybe two moving averages. Seeing things close below or above the first, or maybe both averages, they would anticipate the crossover and get into a profitable trade sooner – or so they thought.
Then came the personal computer. Geeks’ and traders’ heaven, allowing for endless back-testing, searches for the Holy Grail, and games! So they went to work and so-called ‘definitive’ moving averages to use for any instrument were decided upon. So 7 day, 15 and 55 day, moving averages were born; later other slightly more complex ones. Believe it or not these persist today, rather like other urban myths, because they are forgetting that the leopard can change its spots. The sort of dead in the doldrums market can suddenly turn into a whirlwind, as EUR/CHF has proved this year. What sort of moving average would have predicted that?
As if these weren’t problem enough, then came the clever-clogs with Bollinger bands (centred around a 20 day moving average) and Ichimoku clouds (9 and 26 day averages). Ballooning when the market hit a trend in the case of the former, creaking when markets moved sideways for the latter, another set of averages had to be monitored. 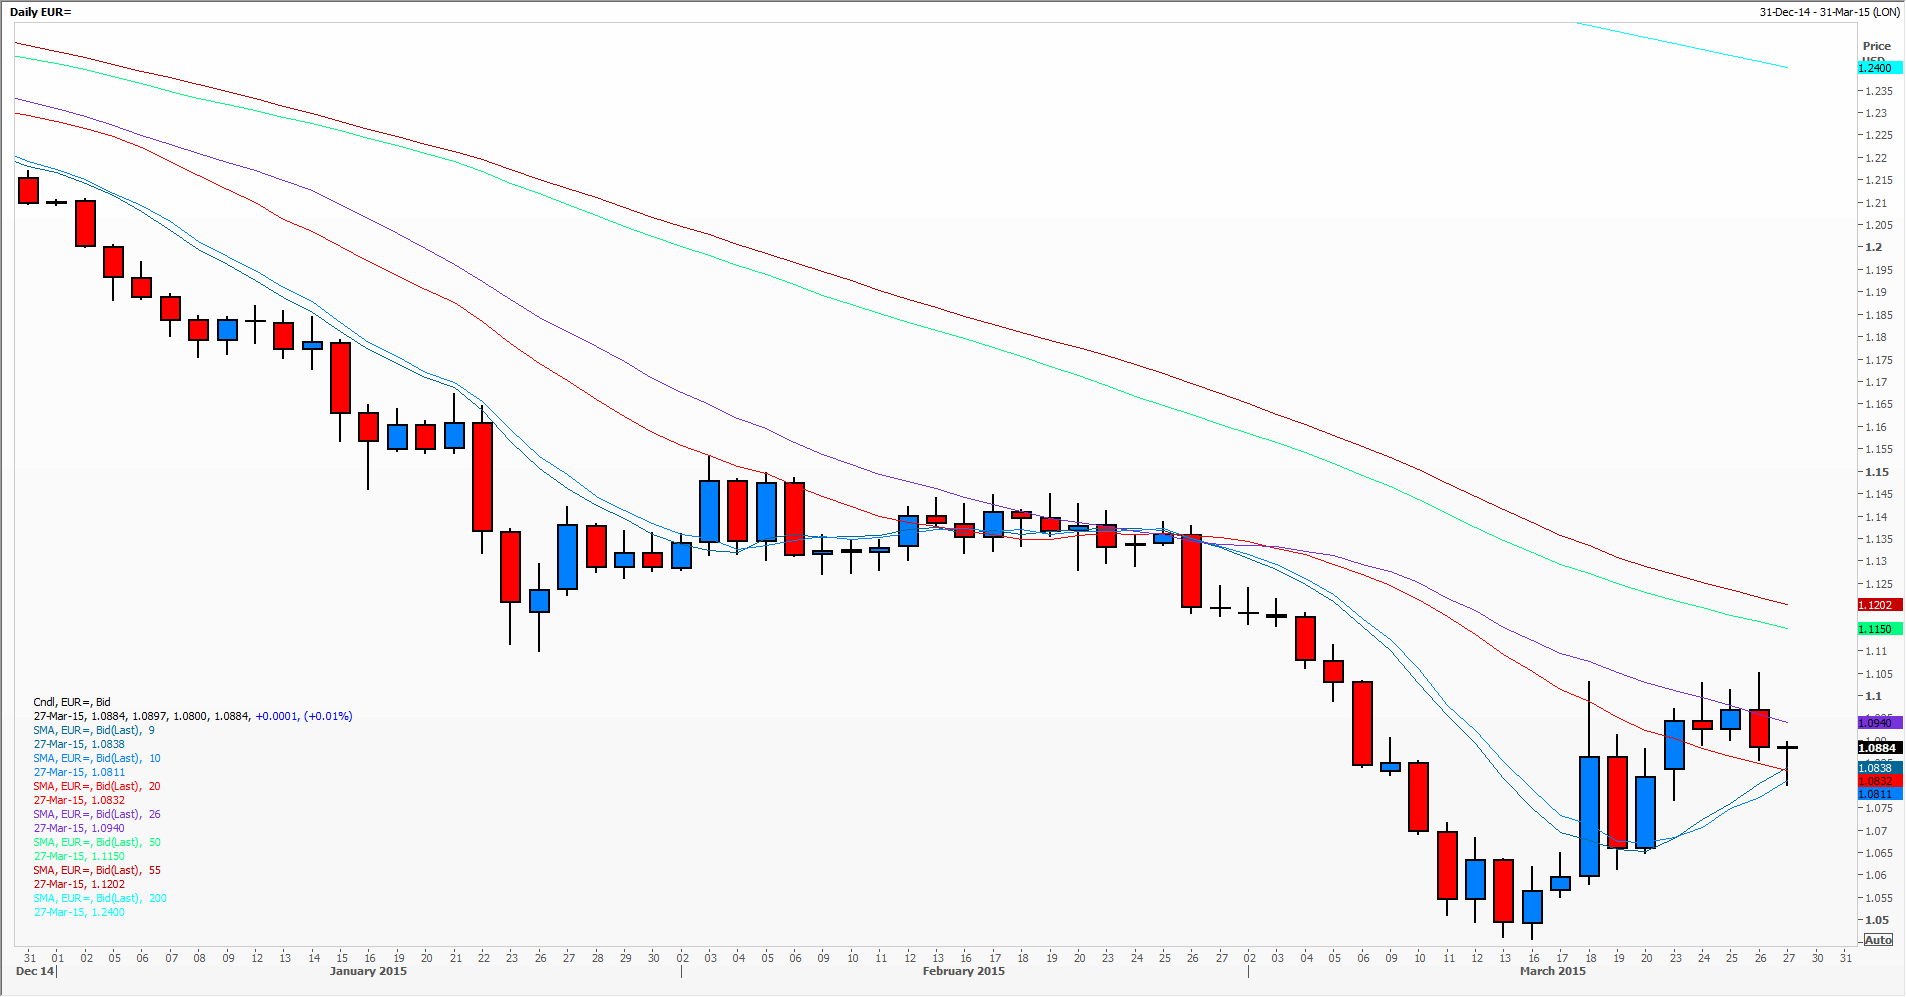
The chart example here, with seven different moving averages, is of how many US dollars one needs to buy a euro, deliberately chosen as it has been on a seriously fast trend for the last nine months. I’m not sure which of the averages I would use, either yesterday or today. Possibly the whole choice of averages has become too academic or too precious.
Tags: crossover, exponential, Foreign exchange, FX, moving average, trending
The views and opinions expressed on the STA’s blog do not necessarily represent those of the Society of Technical Analysts (the “STA”), or of any officer, director or member of the STA. The STA makes no representations as to the accuracy, completeness, or reliability of any information on the blog or found by following any link on blog, and none of the STA, STA Administrative Services or any current or past executive board members are liable for any errors, omissions, or delays in this information or any losses, injuries, or damages arising from its display or use. None of the information on the STA’s blog constitutes investment advice.


Latest Comments