An old-fashioned line chart For today’s volatility
Only economists use line charts. We technical analysts have developed far more sophisticated methods, first bar charts, then bar charts with opening and closing levels which morphed into candlesticks, not forgetting those with no time scale along the bottom like Point & Figure, Renko, and the Japanese Three Line Break.
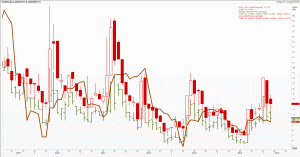
But sometimes simpler is savvier. Here we are looking at the volatility, on a monthly basis of Australian dollar futures contracts (quoted against the US greenback). The brown line is not an artist’s mixture of the red candles and green bars, but is the observed volatility, on a close-to-close basis, of the contract traded on the Chicago Mercantile Exchange. From a peak at over 30 per cent in 2009 it currently trades at what some see as a relatively subdued one third of that.
The red candles are the monthly range of the implied volatility (used to calculate the exact premium paid) on ten delta at-the-money puts on the Aussie (the right to sell these and own US dollars). Several very important features stand out: they generally trade dearer than actual volatility (except in 2012); they are consistently higher than the green bars; they suffer from massive monthly fluctuations at times.
The green bars are the implied volatility on an equivalent call option (the right to own the Australian dollar). The skew, the difference in implied volatilities, tells you which way and how far investors are voting with their feet. Notice how sometimes they overlap, with the green bar pushing into the candle, though not terribly often. Over time as sentiment switches, the position of these two will reverse; option writers keep a keen eye on this.
By displaying three different types of charts we avoid overlap and things are neater. Always make room for an old hand.
Tags: bar chart, candles, FX, line chart, options, volatility
The views and opinions expressed on the STA’s blog do not necessarily represent those of the Society of Technical Analysts (the “STA”), or of any officer, director or member of the STA. The STA makes no representations as to the accuracy, completeness, or reliability of any information on the blog or found by following any link on blog, and none of the STA, STA Administrative Services or any current or past executive board members are liable for any errors, omissions, or delays in this information or any losses, injuries, or damages arising from its display or use. None of the information on the STA’s blog constitutes investment advice.
Latest Posts
- Navigating Mid-2025: Inflation, Markets, Commodities & Strategic Outlooks July 10, 2025
- Why Your Post-Nominals Matter: MSTA & FTSA July 3, 2025
- How I Used Dow Theory to Strengthen My Market Convictions June 20, 2025
- The New Monetary Order: Russell Napier on Inflation, Debt, and Financial Repression June 12, 2025
- Why I Became (and remain) a Member of the STA May 29, 2025


Latest Comments