


The fine line between maths, logic and technical analysis: Don’t chuck the whole lot out
In this week’s Investors Chronicle column I’m writing about the very basics of approaching charts for technical analysis. My extensive reader-base is well above average age, has well above average income and assets, and often has well entrenched views. Not exactly malleable material, shall we say.
So rather than bamboozle them with my superior, extensive trading experience (which is my short-cut), I thought I’d explain where and how technical analysis uses many elements that they have already incorporated into their thinking. From there it’s a relatively painless step into further research which I believe they’d thoroughly enjoy.
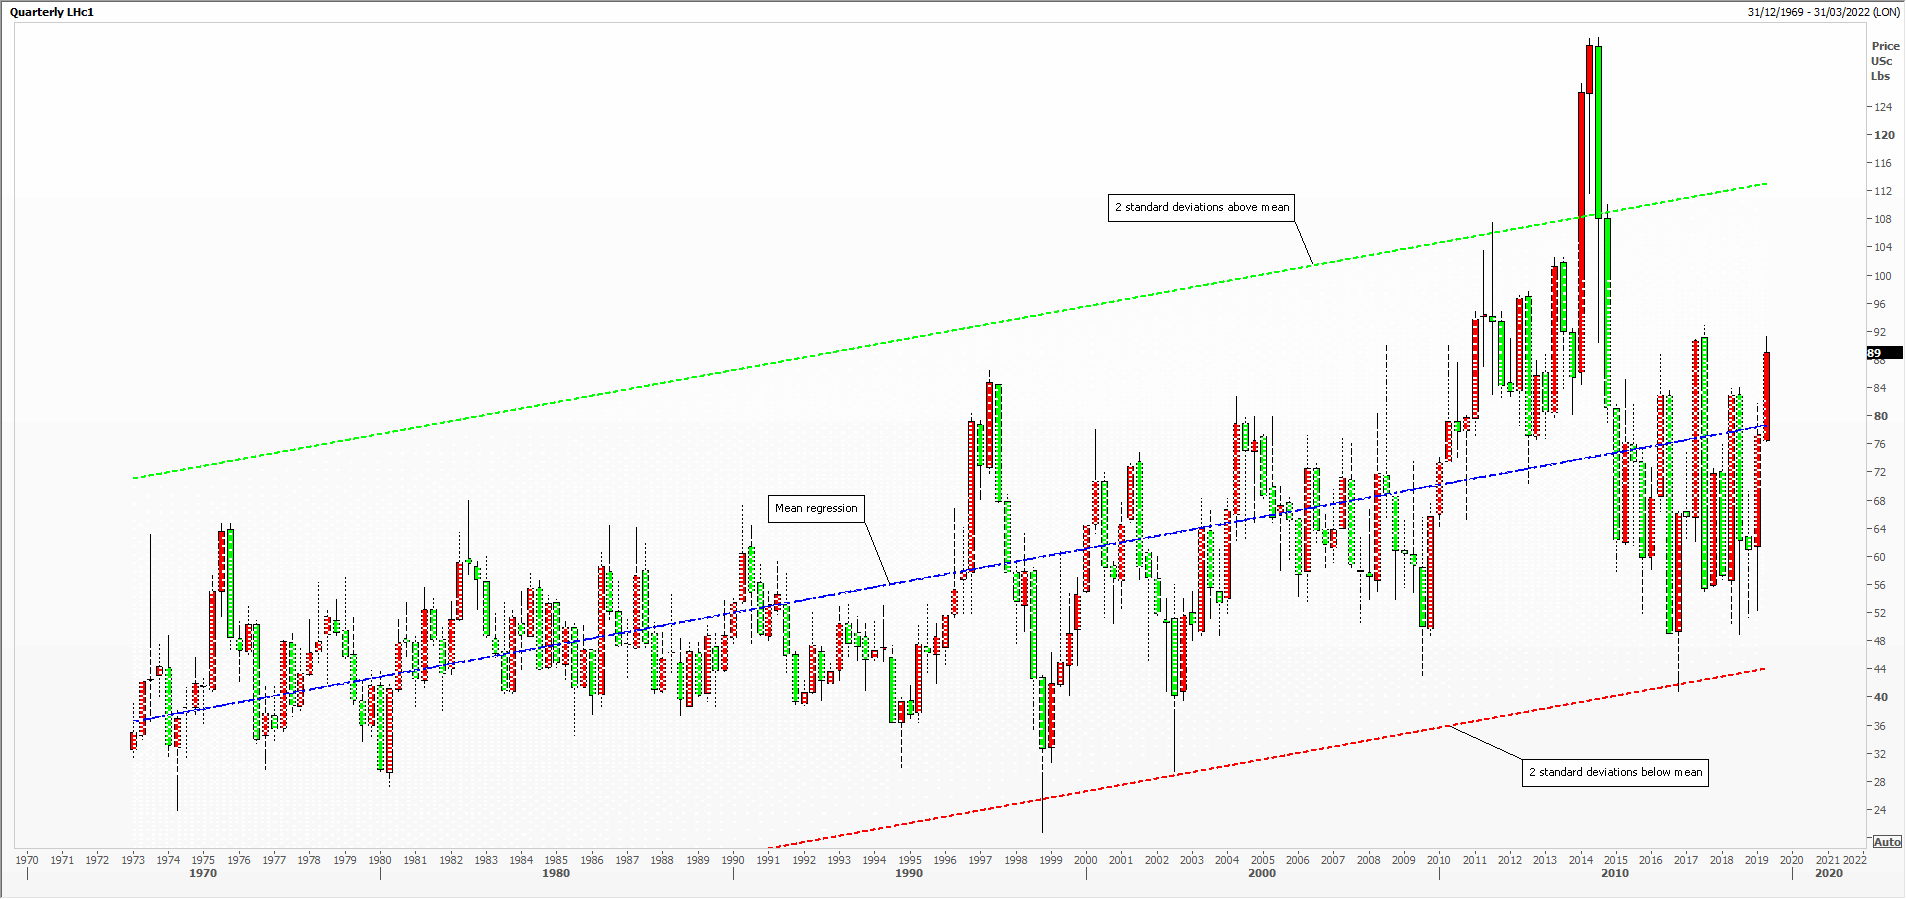
Using charts of different time periods for lean hog futures – which, if you’ve never traded, doesn’t matter as most people know something of animal husbandry and its end products. Using a quarterly chart, I suggested they calculate the drawdown from peak to trough, the biggest ever percentage and absolute rally, and decide if they wanted to get involved at all. This is the logical thinking bit.
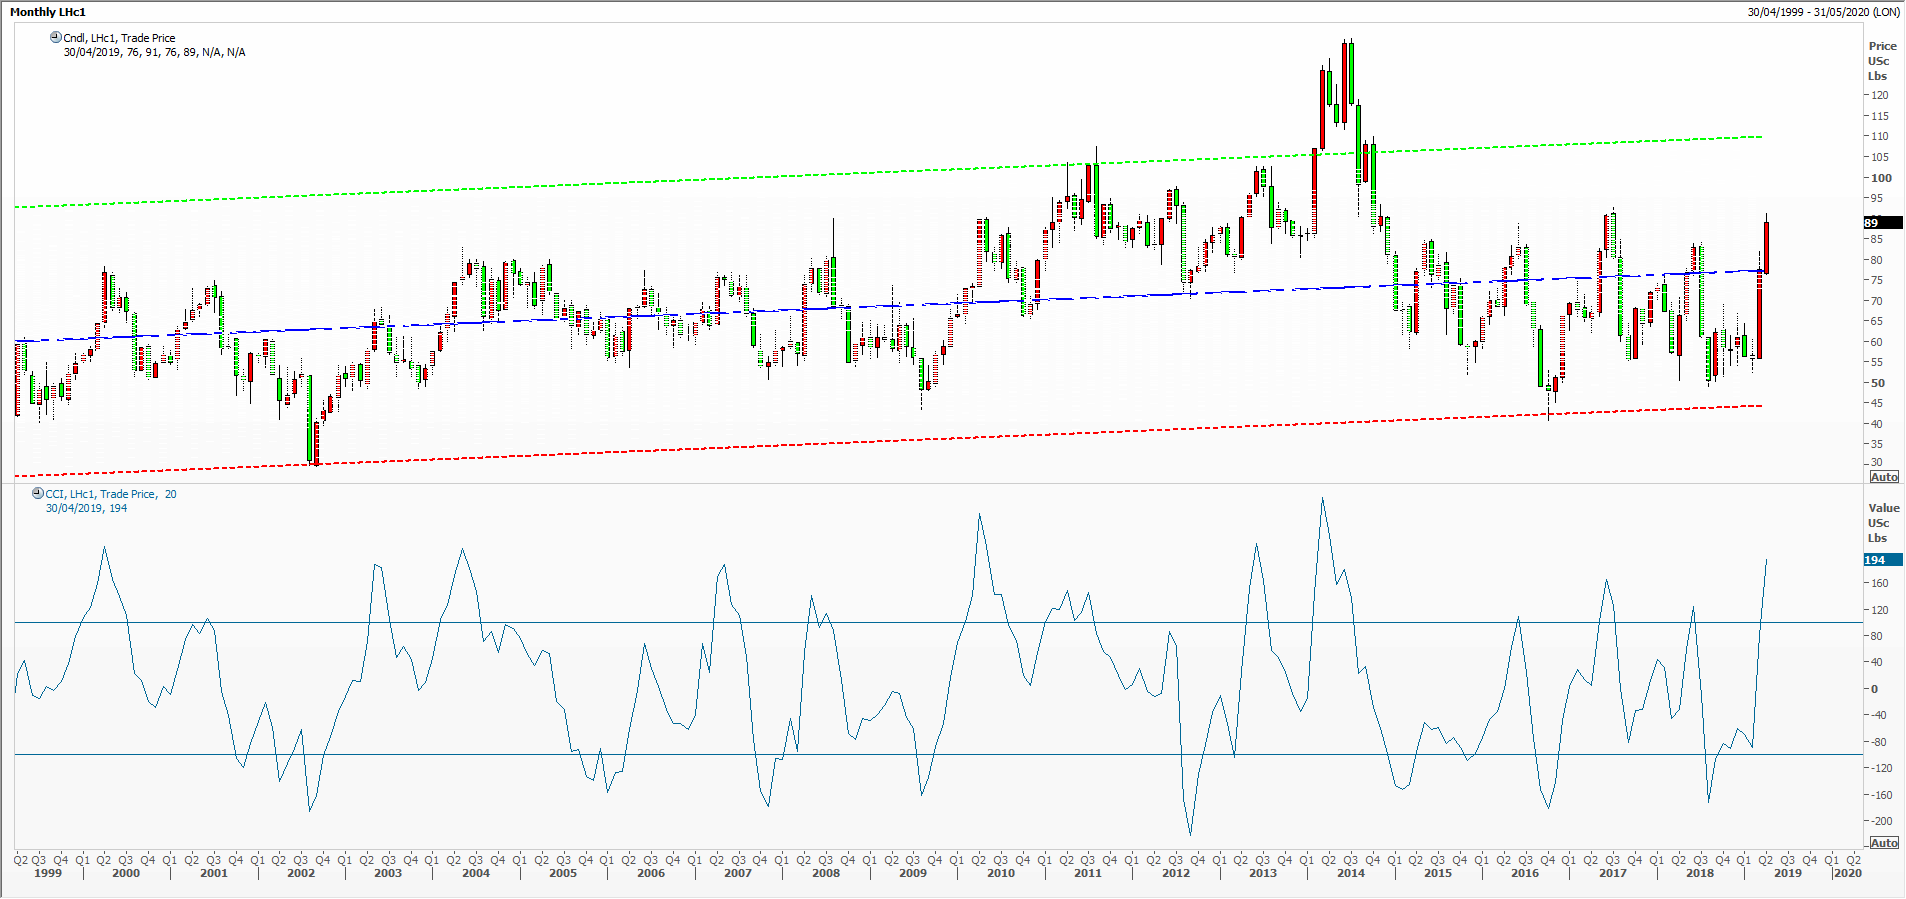
Then I suggested they add the long term mean regression plus one and two standard deviations around this; this is the maths bit. On monthly charts I suggested they look for seasonal cycles – something which ought to be more likely in agriculture. Further research from here might take one to Gann and Fibonacci.
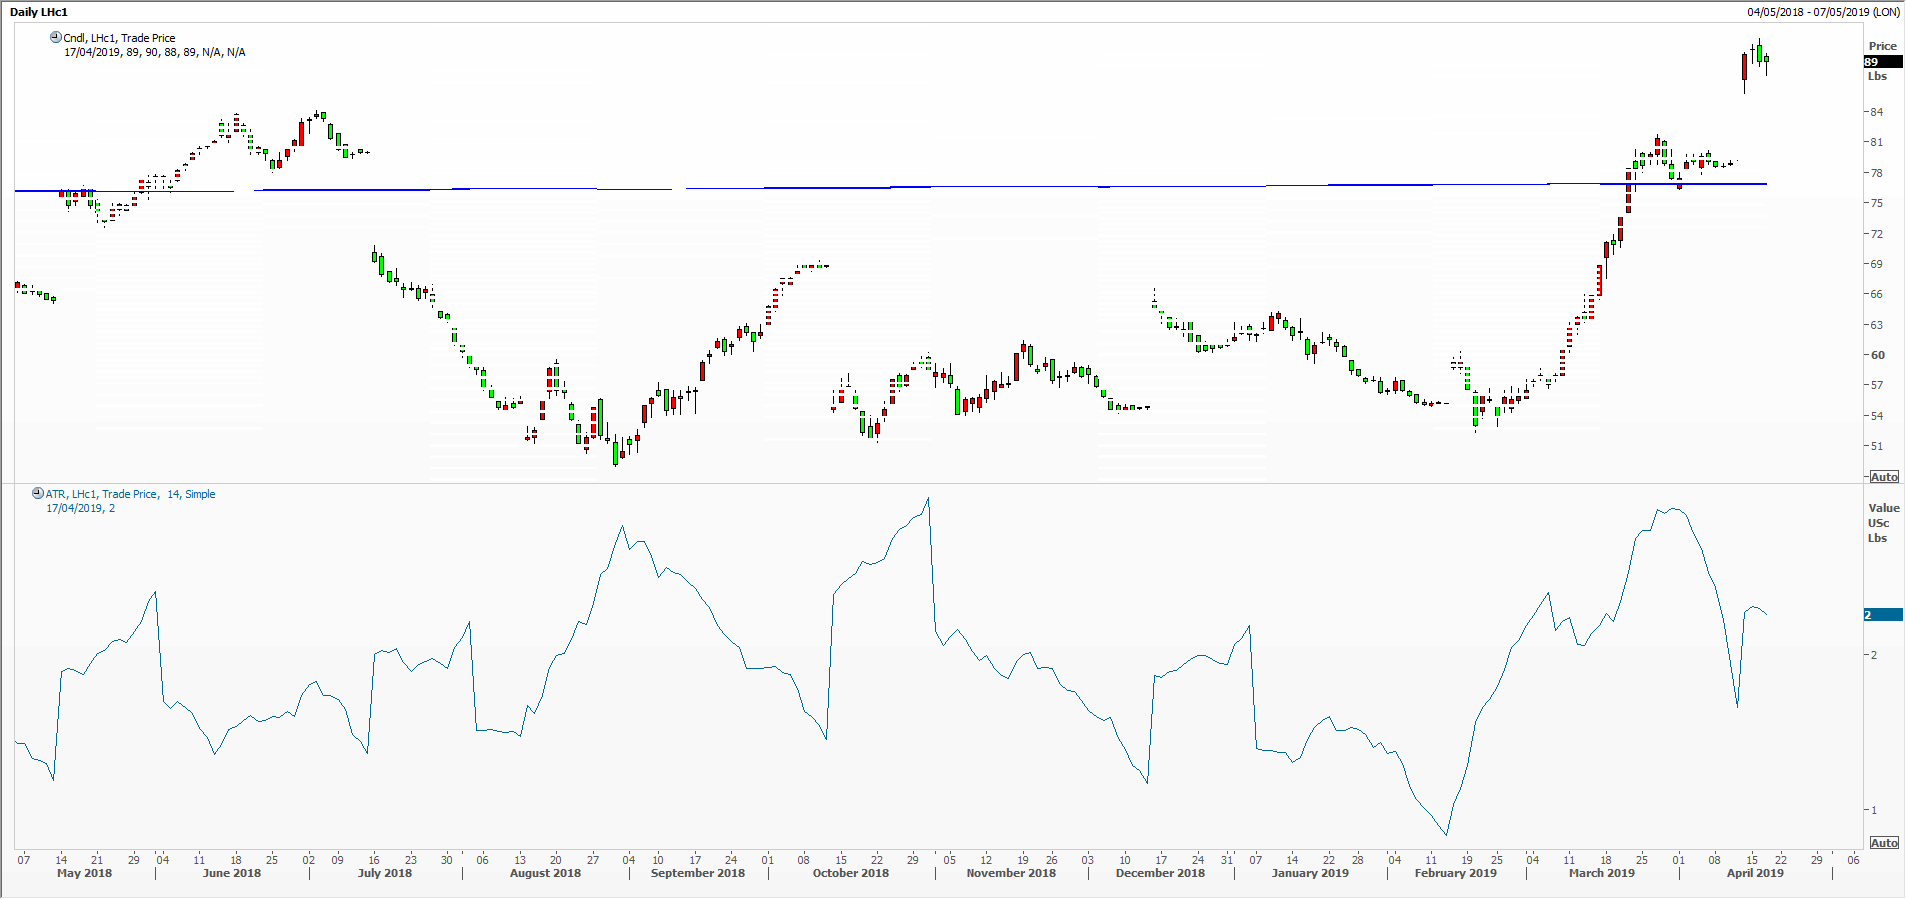
Which set me thinking about Average True Range – clearly a topic for technical analysts. This is, of course, a variation of a measure of volatility – of which there are many! ATR is merely the difference between the highest and lowest prices of the observed period (usually daily data), averaged over 14 periods. To this one includes the distance between current high and the previous close, and current low and the previous close. Developed by J. Welles Wilder Jr., this calculation is just an average of absolute changes. And because most people don’t use this method on intra-day data.
The views and opinions expressed on the STA’s blog do not necessarily represent those of the Society of Technical Analysts (the “STA”), or of any officer, director or member of the STA. The STA makes no representations as to the accuracy, completeness, or reliability of any information on the blog or found by following any link on blog, and none of the STA, STA Administrative Services or any current or past executive board members are liable for any errors, omissions, or delays in this information or any losses, injuries, or damages arising from its display or use. None of the information on the STA’s blog constitutes investment advice.


Latest Comments