


The Day of the (Living) Dead: Ghosts and ghouls at this time of year
Halloween yesterday on the 31st October passed without incident – despite an unexpected carved orange pumpkin being plonked on my gatepost. All Saints Day today, 1st November, has seen drizzle, sudden downpours and bright sunshine alternate quickly in London. Tomorrow, Wednesday the 2nd November is All Souls Day and a big one in the Mexican calendar: Día de los Muertos.
This set me thinking about the countdown to year-end: UK Guy Fawkes on the 5th November, US Thanksgiving on the 24th, festive parties ahead of Christmas Eve on the 24th December and the Day itself for the British lunch (and new King’s speech, I presume) on the 25th. Before you know it, it’s New Year and the whole world is on holiday. All of the above mean trading will be winding down, risk attitude will reduce, positions closed ahead of year-end and the authorities will dare to take a breather.
But are they right to do so? I take a look at three of the many scary charts at the moment. 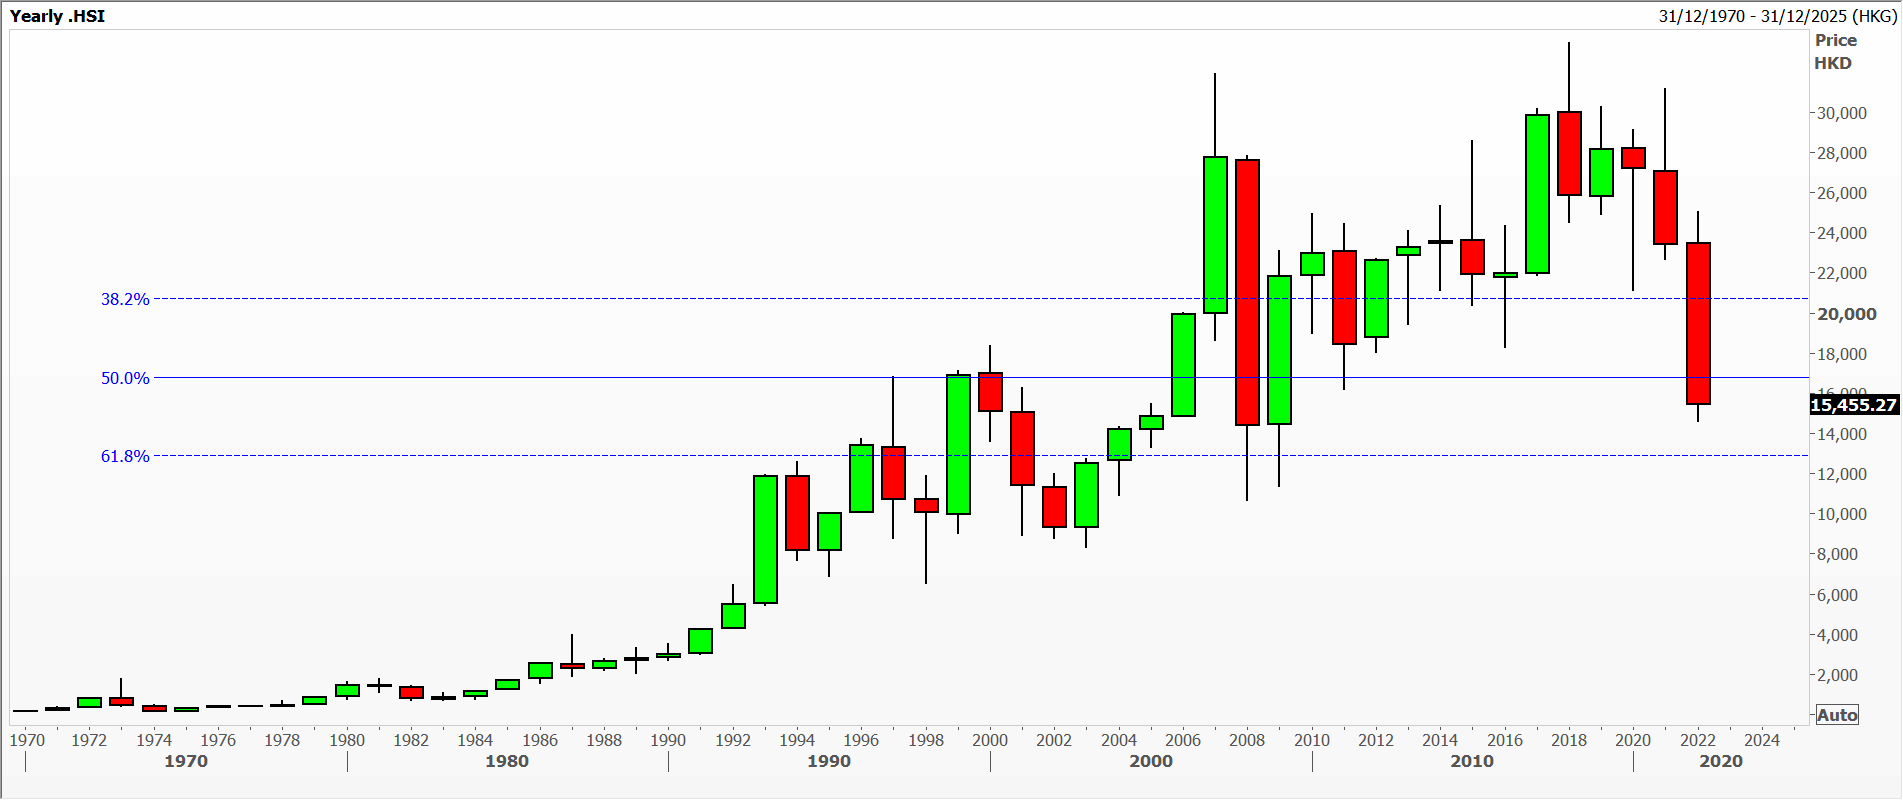 The first is Hong Kong’s Hang Seng Index over the last half-century with a yearly candle chart. I remember when not only this was a truly emerging market but it was also an outstanding performer in the 1980s. Today it’s given back a cool half of those gains, is back at levels it hit pre-Asian crisis and Russia chaos on 1997/1998. So much for sitting it out over the long term.
The next zombie suspect is more subtle, 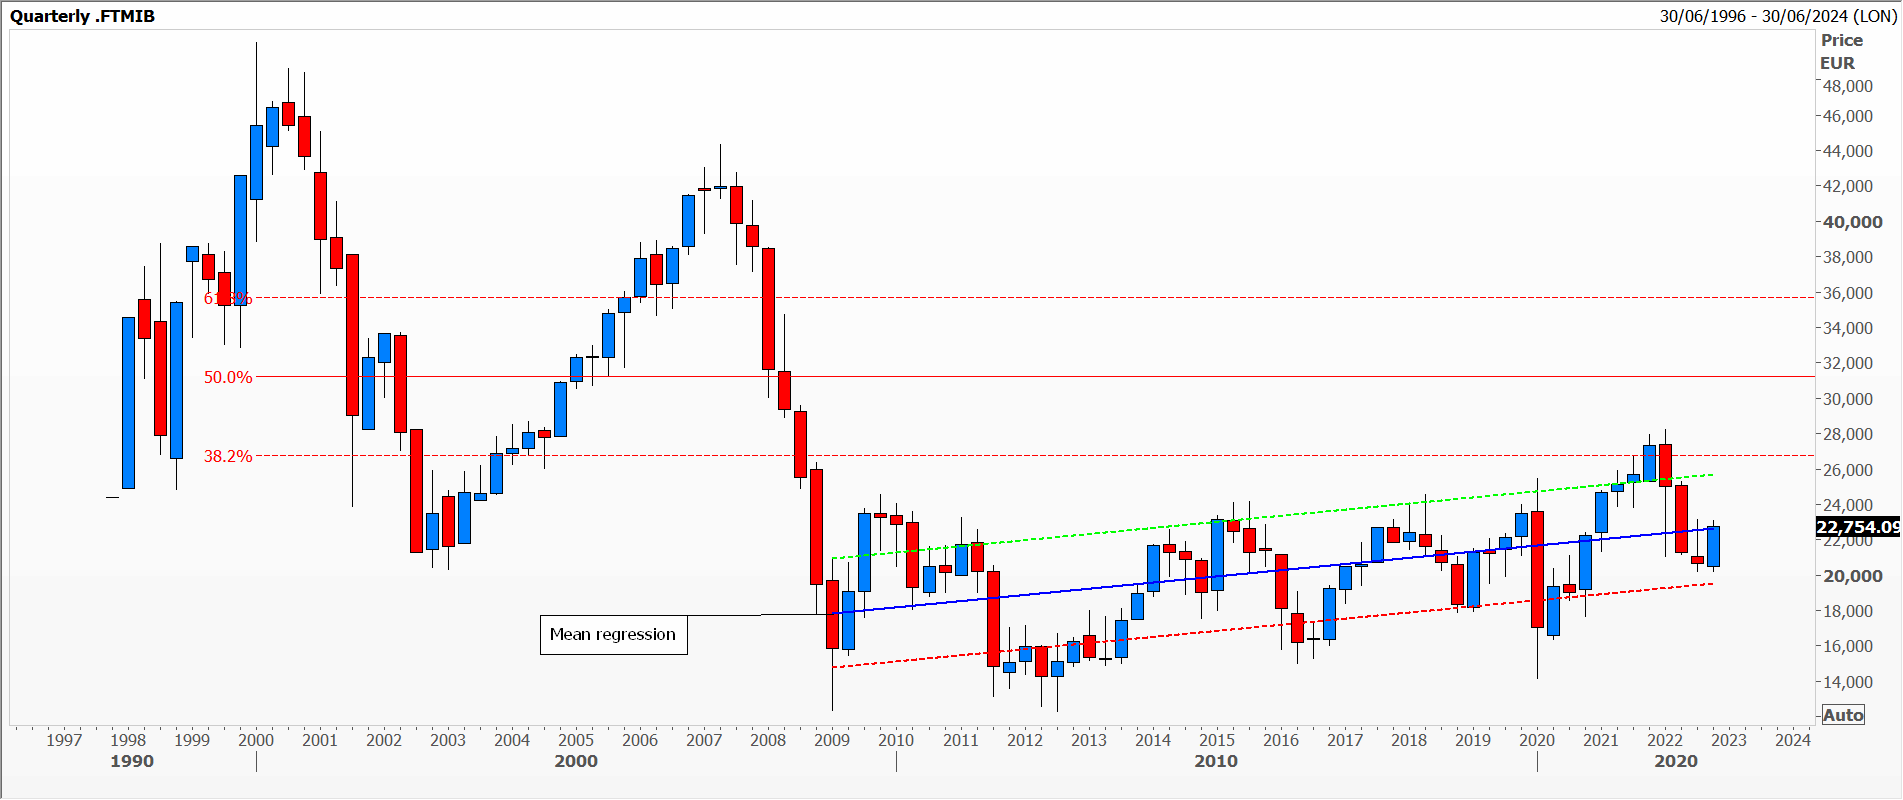 Italy’s MIB stock index with a quarterly chart. Peaking at 50,108 in the Millennium year and, after two catastrophic falls between 2000 and 2009, the index has traded narrowly around a standard deviation since then, currently worth less than half of peak, and unable to rally above a Fibonacci 38% retracement of the declines on this chart, I only hope not too many potential Italian pensioners are holding shares in this index.
My last and more recent chart is that of 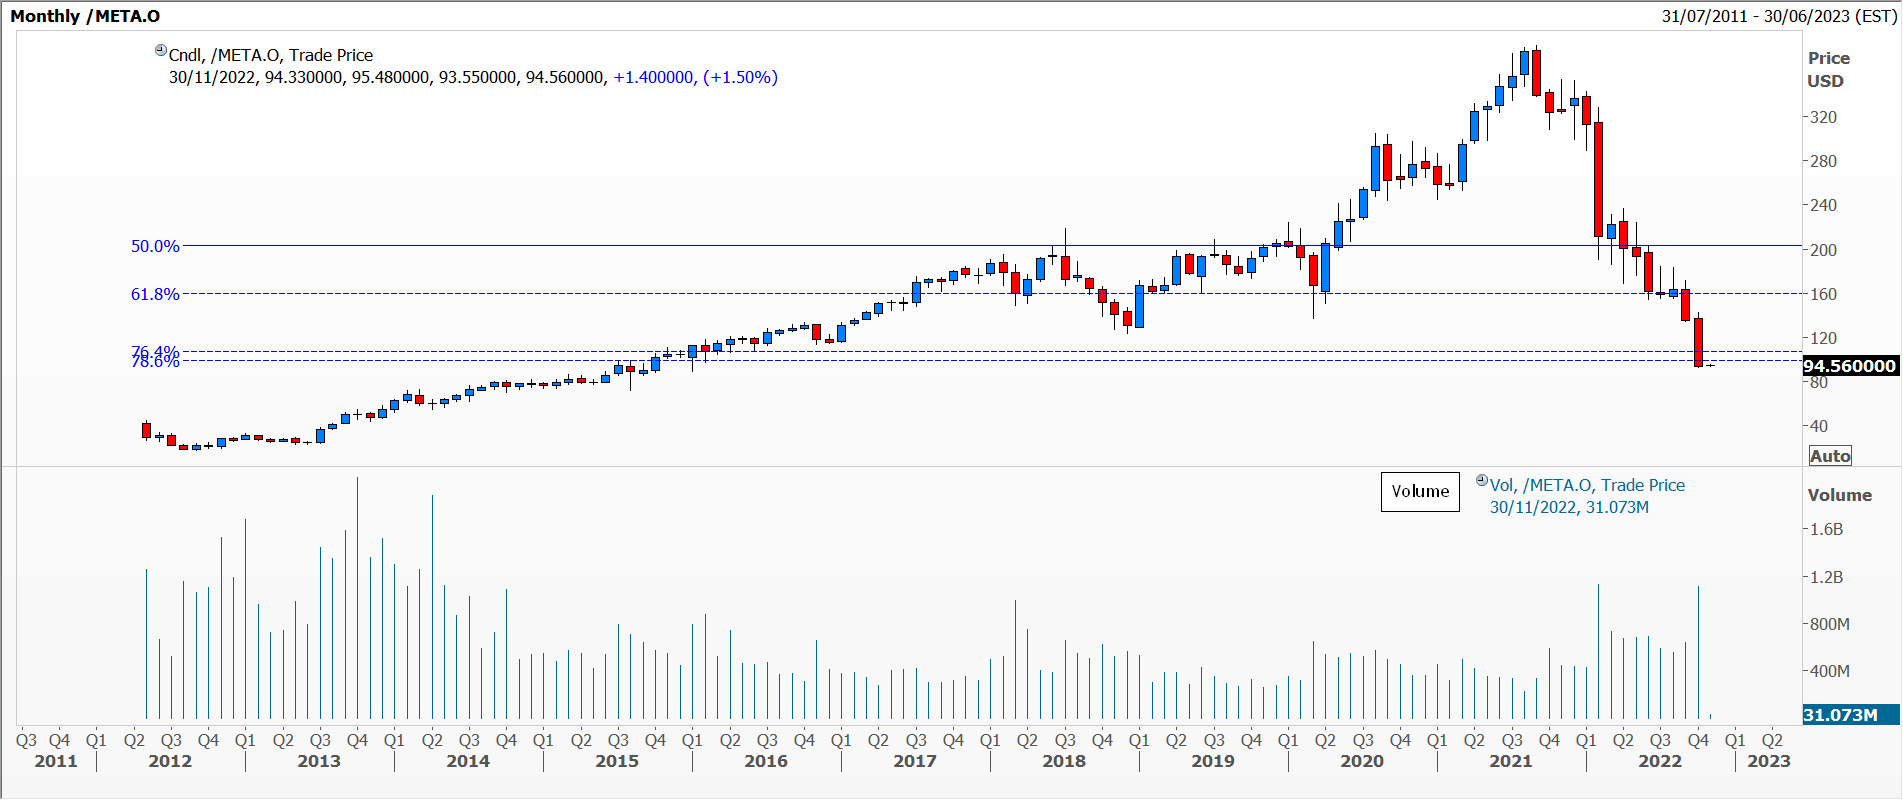 Meta – Facebook as many of us still think of it, and a monthly chart. It has given up an astonishing 78% of gains over the last decade – over a mere 13 months. From a peak at 384.33, it’s now worth less than a quarter of that. To regain the 75% losses of this year, it will have to rally by 408% to match the record high. The cruelty of mathematics!
Tags: background, Bear markets, depression, loss
The views and opinions expressed on the STA’s blog do not necessarily represent those of the Society of Technical Analysts (the “STA”), or of any officer, director or member of the STA. The STA makes no representations as to the accuracy, completeness, or reliability of any information on the blog or found by following any link on blog, and none of the STA, STA Administrative Services or any current or past executive board members are liable for any errors, omissions, or delays in this information or any losses, injuries, or damages arising from its display or use. None of the information on the STA’s blog constitutes investment advice.


Latest Comments