


Secondary, tertiary, and other indicators
We all know that the prime mover of technical analysis is a time series analysis of market prices, sometimes labelled as ‘descriptive statistics’ by statisticians. They then call all further analysis based on this data ‘inductive statistics’ which include forecasts, generalisations, and extrapolations.
As technical analysts we are all aware of secondary indicators, things like volume, open interest, implied volatility, and Commitment of Traders’ Reports (COT). We also massage price data in all sorts of mathematical ways to create oscillators, to smooth series and try to eradicate ‘noise’.
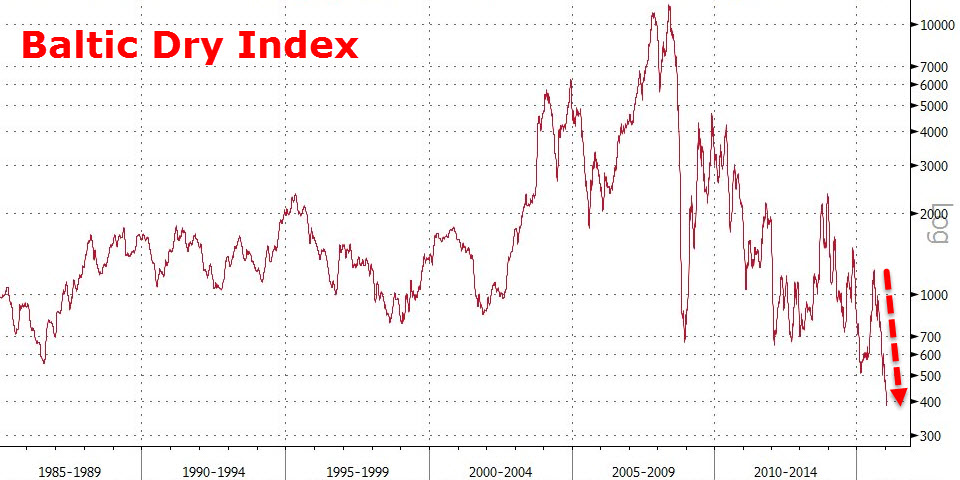
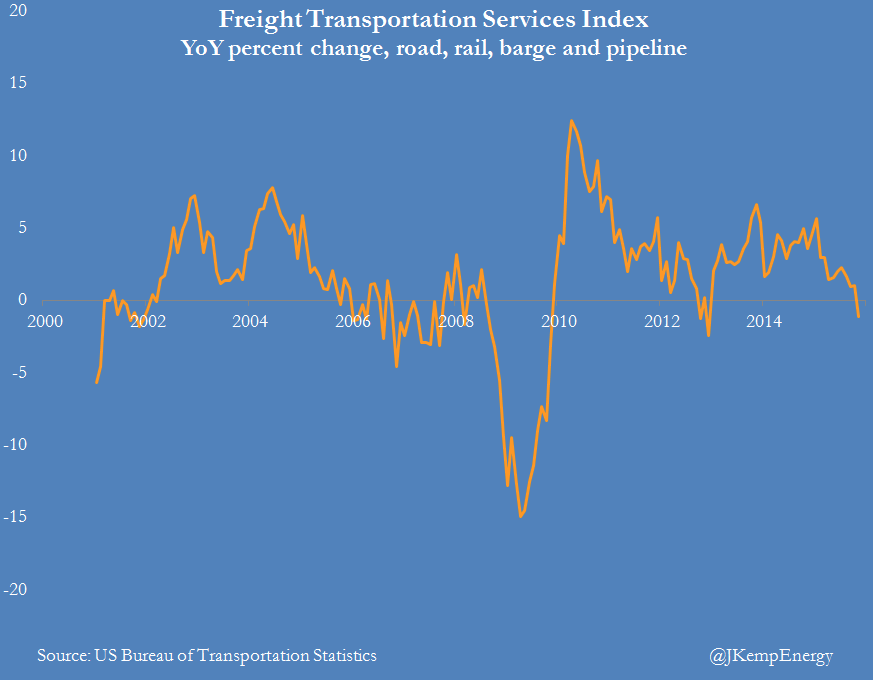
But we also have rather more distant and random things that might be relevant to forecasting the markets. Lore says that the height of ladies’ hemlines is an early warning signal of the strength of the stock market: the higher the better! Likewise the price of Baltic shipping indices can warn of a slowdown in international trade. So too the volume of railroad cars travelling across the United States, something that has been monitored for decades and gives rise to the interchange between the words futures ‘contracts’ and ‘cars’ – grain futures being the size of one railroad wagon.
Roger Babson (1875-1967) was one of the first professional US macro-economic and market forecasters, neither an economist nor technical analyst. One of the first to recognise the business cycle his focus was on crop production. A contemporary of his, Samuel Benner (1832-1913) thought ‘pig-iron is the barometer of trade, and as the sudden falling of the mercury denotes violent changes in the atmospherical world, so does the periodical decline in pig-iron indicate panic, depression and general stagnation in business’.
More recently another barometer has been added: the height of skyscrapers. Sometimes seen as symbols of over-optimism or man’s vainglory, one wonders as to the wisdom of Riyadh’s ‘Kingdom Tower’, designed to be, at one kilometre high, the tallest in the world.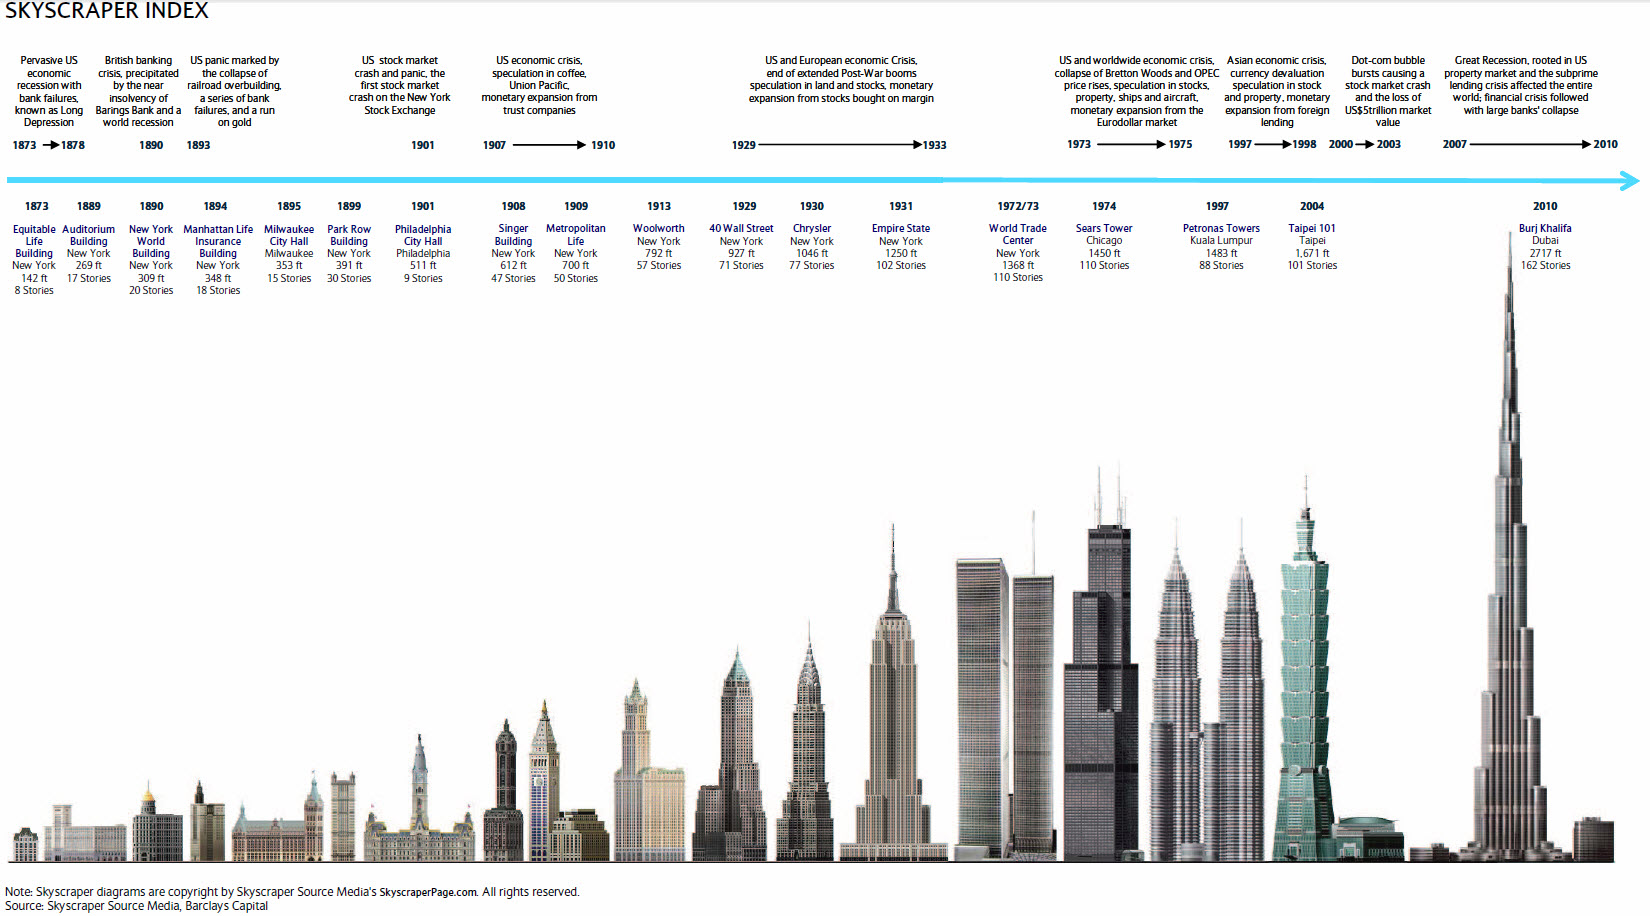
Now it’s your turn to think of which parallel and apparently random series might be relevant to today’s markets. Microchips are old hat, but do please write in with suggestions.
The views and opinions expressed on the STA’s blog do not necessarily represent those of the Society of Technical Analysts (the “STA”), or of any officer, director or member of the STA. The STA makes no representations as to the accuracy, completeness, or reliability of any information on the blog or found by following any link on blog, and none of the STA, STA Administrative Services or any current or past executive board members are liable for any errors, omissions, or delays in this information or any losses, injuries, or damages arising from its display or use. None of the information on the STA’s blog constitutes investment advice.


Latest Comments