


Of predictive value: yes or no?
Very recently I came across this chart of the S&P 500 index. It shows the major downturns it has seen four times since the 1970’s, where each one starts at a theoretical 1 (or 100 per cent). Every one of these has resulted in an approximately 50 per cent decline (not adjusted for inflation, of course, so in real terms the 1972 one punished investors the hardest). The longest losing streak was the one from what had been a then record high in the year 2000; that of 2007-2009 the sharpest developing over only 20 months.
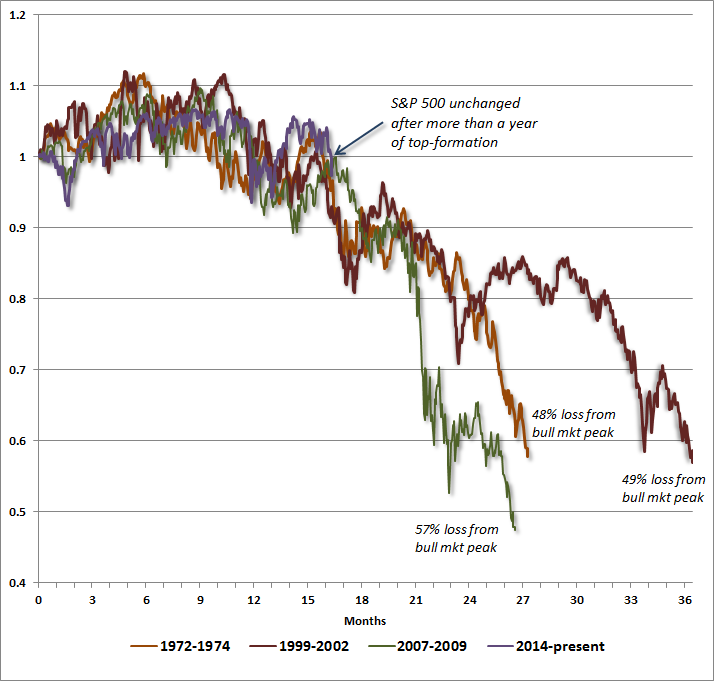
All the lines plotted start well before the real damage is done and include a good year/year and a half of dithering close to the highs before the serious selling begins. Now look at the purple line; this is price action since the beginning of 2014 and before April’s new record high. Almost 18 months’ worth of guttering around the 1 level. The implication: that moves will follow those of the three previous bear markets.
I used to really like this sort of mapping. You have to admit that it gives an anchor and a sort of confidence in foretelling what might be difficult times ahead. Certainly out to 21 months it works quite well.
Now look at the second chart. What we’ve done is plot first the Nikkei 225 index as a quarterly candlestick chart (axis right hand side). To this we have overlaid the Dow Jones Industrial Average shifted by 40 periods (ten years) to the left (axis on the left). In this way the Nikkei’s 1990 peak aligns with the 2000 high for the Dow. I clung to this chart. And it worked quite well (albeit on a rather rough and ready basis) for about five years.
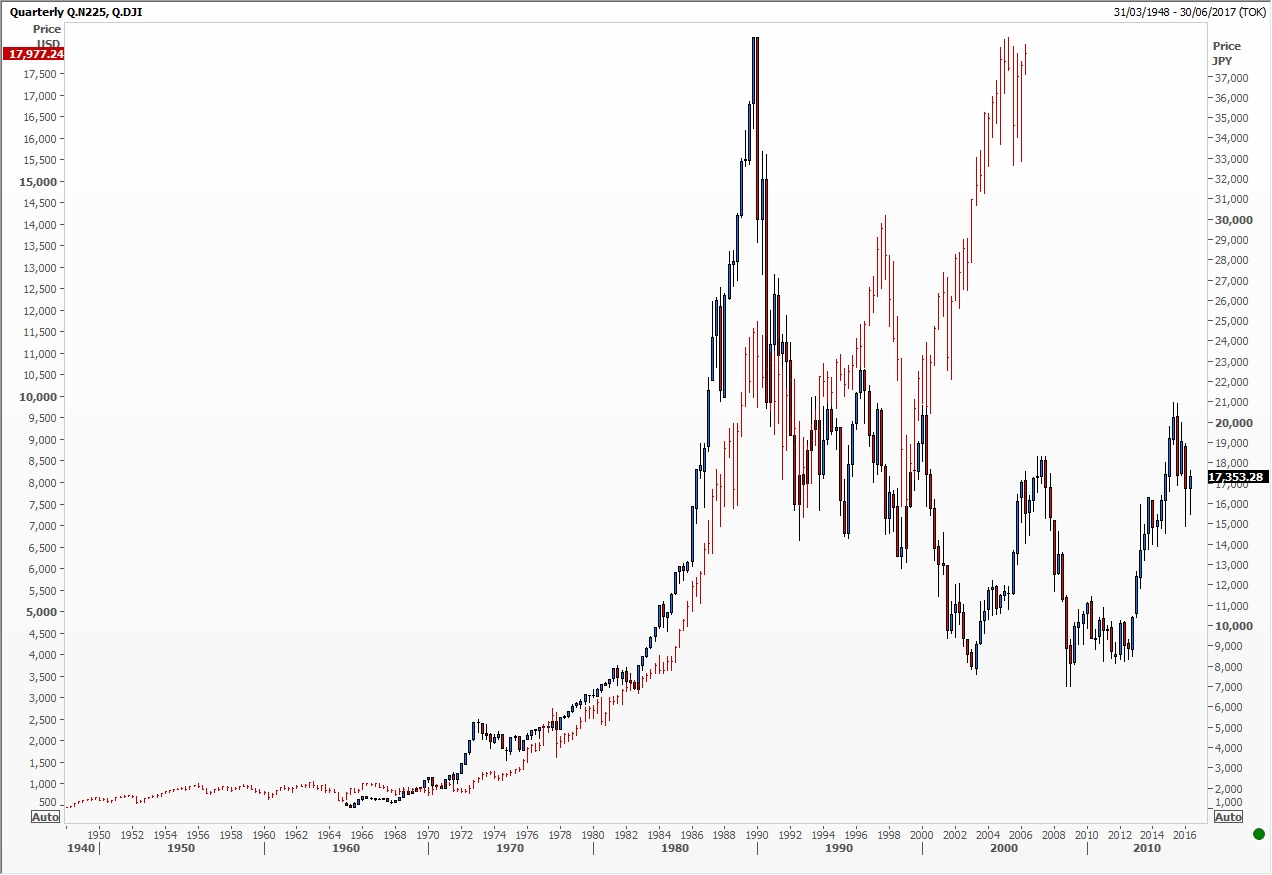
Look at it now. No resemblance what so ever. Next step, adjusting for exchange rate moves. You see, not as easy as you might think.
Tags: Dow Jones Industrial Average, Nikkei 225, S&P 500
The views and opinions expressed on the STA’s blog do not necessarily represent those of the Society of Technical Analysts (the “STA”), or of any officer, director or member of the STA. The STA makes no representations as to the accuracy, completeness, or reliability of any information on the blog or found by following any link on blog, and none of the STA, STA Administrative Services or any current or past executive board members are liable for any errors, omissions, or delays in this information or any losses, injuries, or damages arising from its display or use. None of the information on the STA’s blog constitutes investment advice.


Latest Comments