


Picking your moving averages apart: tweaking versus crossovers
If I use moving averages at all – and these are certainly not one of my preferred technical analysis tools – I opt for the 9 and 26-period ones of the Ichimoku cloud system; I will also use a crossover method with the 50 and 200-day ones. Many people are happy with the crossover method, giving buy signals when the shorter term one rises over the longer term one, sell signals when it dips below the longer one. They then tend to fiddle around with the chosen periods of the averages, on hourly, daily and weekly charts, something which involves many hours of back—testing. They are looking for the Holy Grail.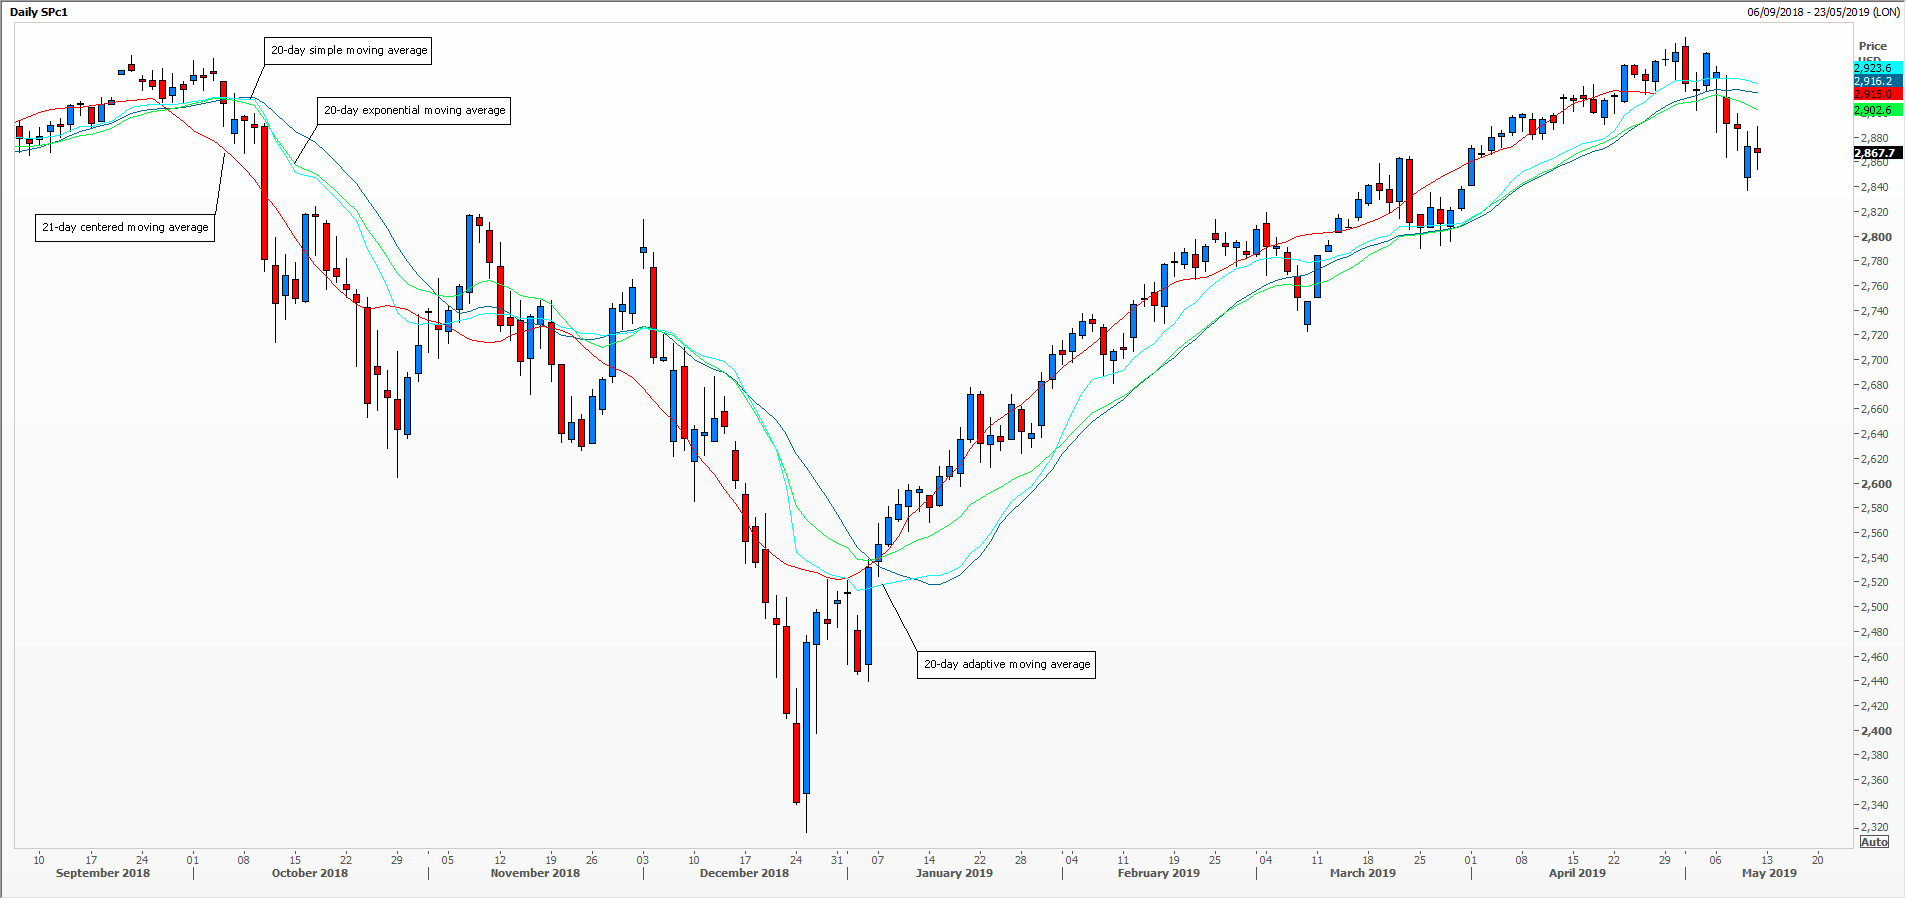
Frustration with the crossover method in sideways markets often forces traders into digging a bit deeper, and they come across an impressive array of other types of moving averages. The next step is the exponential moving average, where recent price data is given more weight, and therefore more importance, than older data. Look at the chart and you will see that at important market turns in the S&P 500 index the green line has reacted faster than the simple one. However, during 2019’s steady rally, there’s not much to choose between the two.
The centered moving average (red line), which works best for uneven time periods, plots the result of a simple moving average calculation at the central point of the dates used. In this case at day 11 of the 21-day period. The drawback is that it’s literally behind the curve. Look at the red line at the right of the chart; it stops on the 24th April.
My fourth line (the pale blue one) is an adaptive moving average, something developed by Perry Kaufman. What it attempts to do is adjust to market circumstances, considering small versus big moves in the chosen period. Think of it as a sort of Bollinger band, narrowing in times of low volatility and fanning out during sudden surges. See how it tumbles quicker than the others in October and December 2018, then rising more quickly in February 2019.
A suggested final step might be a crossover method using to different moving averages of the same period, for example the centered moving average with the simple one.
Tags: adaptive, crossover, exponential, moving average
The views and opinions expressed on the STA’s blog do not necessarily represent those of the Society of Technical Analysts (the “STA”), or of any officer, director or member of the STA. The STA makes no representations as to the accuracy, completeness, or reliability of any information on the blog or found by following any link on blog, and none of the STA, STA Administrative Services or any current or past executive board members are liable for any errors, omissions, or delays in this information or any losses, injuries, or damages arising from its display or use. None of the information on the STA’s blog constitutes investment advice.


Latest Comments