


Markets on the move: Early warning indicators
Donald Trump won the US Presidential election promising to ‘make America great again’. Markets and investors took him at his word, hoovering up the US dollar and selling the most vulnerable – the Canadian dollar and Mexican peso – hard. Since early May, and despite the US Federal Reserve raising interest rates, the mood has changed and the greenback’s been on a losing streak. The US dollar index is now weaker than it was just before the vote, the euro and several other currencies are trading at their strongest in two years, and others have seen their value rise by 10 per cent so far this year.
But which of the vast array of technical indicators and oscillators might have given us an early warning signal that this was about to happen? Obviously not conventional moving averages, and by extension the Ichimoku cloud system, as these are lagging mathematical constructs. Likewise historical volatility can only look back in time, though not implied option volatility.
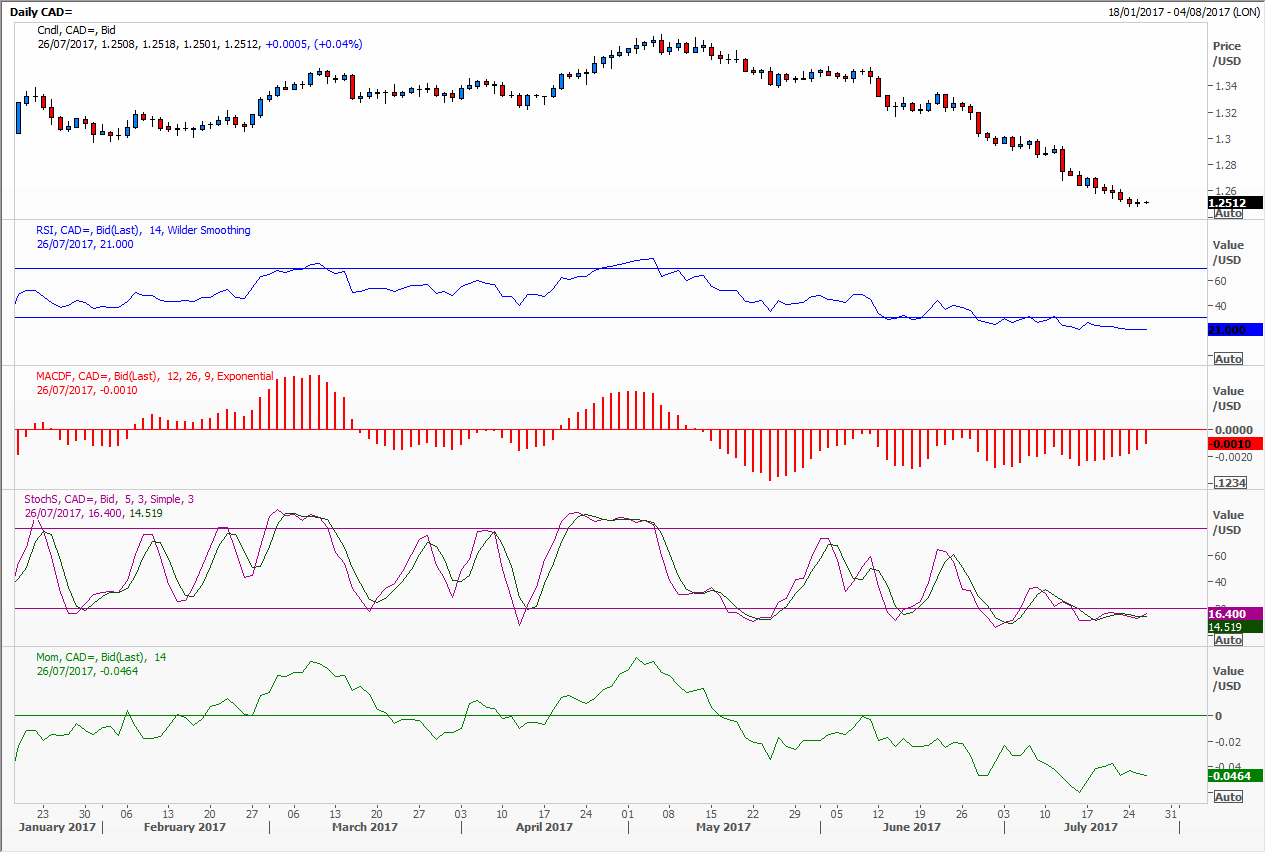
Using the Canadian dollar as our example (as it has seen this year’s biggest reversal in fortunes) we compare a number of well-known analyses. Both the MACD forest and Momentum peaked initially in early March – which then proved to be too early. The Relative Strength Index and Slow Stochastic mirrored these moves. Interestingly the MACD and Momentum have been consistently bearish since mid-May keeping you short for what has been almost 10 consecutive weekly declines.
The second chart uses a Bollinger Band, the Parabolic Stop And Reverse, and Exponential Moving Average, and a 2 percentage Envelope. The SAR along with the price closing below the moving average turned first, closely followed by the Bollinger on the close of the 19th May. All of these struggled and were whipsawed through to mid-June, and the lower Bollinger would have closed your position repeatedly all the way down. The Envelope does not really give a sell signal, it merely mirrors price action, but its lower edge did a sterling job mapping the lows nicely.
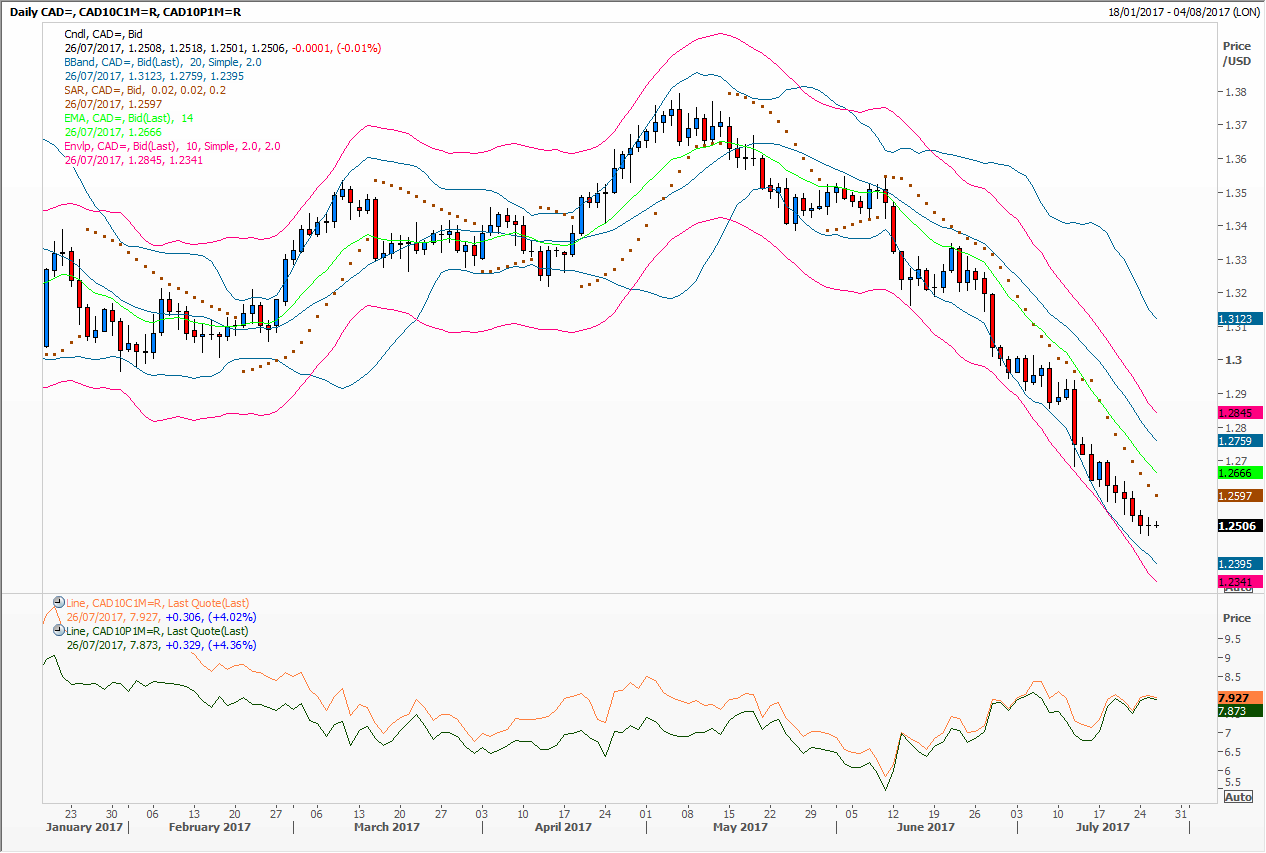
At the bottom we have plotted implied volatility for 10 delta at the money calls and puts expiring in a month’s time. The difference in the cost of these – the volatility being used in the Black Scholes model – is known as the skew and reflects investors’ willingness to back their hunches. Through to mid-June calls on the US versus the Canadian dollar had been persistently more expensive, even as the outright cost of options dropped. On the 13th June the volatility used for both puts and calls was 7 per cent, meaning that bears on the ‘loonie’ (as the Canadian dollar is called) had begun to back off. Today these are still neck and neck, hinting that despite the relentless decline in this exchange rate long term investors remain unconvinced.
Tags: indicators, momentum, oscillators, signals
The views and opinions expressed on the STA’s blog do not necessarily represent those of the Society of Technical Analysts (the “STA”), or of any officer, director or member of the STA. The STA makes no representations as to the accuracy, completeness, or reliability of any information on the blog or found by following any link on blog, and none of the STA, STA Administrative Services or any current or past executive board members are liable for any errors, omissions, or delays in this information or any losses, injuries, or damages arising from its display or use. None of the information on the STA’s blog constitutes investment advice.


Latest Comments