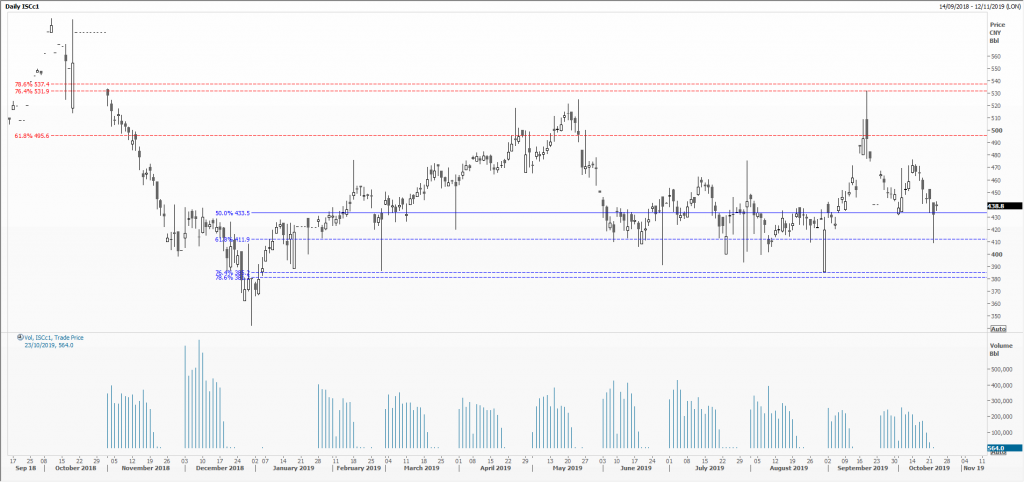
‘Market action discounts everything’ says Technical Analysis: But sometimes price charts lie
Before reading on, take a close and careful look at the chart that goes with this piece. I’ve deliberately not told you what the financial instrument is, nor what it’s priced in, or where it’s traded. It looks, for all intents and purposes, like a perfectly normal daily (it says so in the top left corner) candlestick chart with what is probably volume (Vol) along the bottom. However, it also contains many warning signals that all is not quite right, and perhaps the market hasn’t discounted everything after all; that using it to predict future trends might be highly dangerous.
So, how many things have you spotted? Again at top left, the code used by this data provider is: ISCc1; the c1 tag is often that of the front month futures contract. What do you think of volume? Erratic or substandard at best, clustering at the beginning of the month and negligible later. This suggests the settings the vendor’s using to collate price data might be incorrect, lingering too long before moving on to the next relevant contract. Therefore, all price data late in the month is also subject to the usual issues of thin and irrelevant markets. 
Public holidays might explain why there are so many days where the open and close are the same, with no body to the candle; there seem to be rather too many of these. Again, we might well be following the wrong delivery month.
So many gaps on opening, often at an extreme, subsequently scrambling to get back to something credible. Too many long whiskers/wicks to the candles (spike lows and highs) – another version of a thin market?
Bigger picture: since January this year, it’s rallied from a low around 350 but struggled to hold above 500. That’s a 150 point range or 43 per cent of the initial value. The Fibonacci retracement lines lull one into thinking this market’s been range bound most of this year – but it’s a heck of a range!
Finally, spot top right for the code on the vertical axis: CNY. Ring any bells? The recognised international code for the Chinese yuan. And Bbl: the code many use for barrel of crude oil. This is the front month crude oil future, traded on the new Shanghai International Energy Exchange (INE), part of the Shanghai Futures Exchange (ShFE), as published by Thomson Reuters. And you thought you were in safe hands.
Tags: gaps, holidays, volume
The views and opinions expressed on the STA’s blog do not necessarily represent those of the Society of Technical Analysts (the “STA”), or of any officer, director or member of the STA. The STA makes no representations as to the accuracy, completeness, or reliability of any information on the blog or found by following any link on blog, and none of the STA, STA Administrative Services or any current or past executive board members are liable for any errors, omissions, or delays in this information or any losses, injuries, or damages arising from its display or use. None of the information on the STA’s blog constitutes investment advice.
Latest Posts
- Why Your Post-Nominals Matter: MSTA & FTSA July 3, 2025
- How I Used Dow Theory to Strengthen My Market Convictions June 20, 2025
- The New Monetary Order: Russell Napier on Inflation, Debt, and Financial Repression June 12, 2025
- Why I Became (and remain) a Member of the STA May 29, 2025
- The Emotional Rollercoaster of Markets: Why Bubbles Repeat and How to Outsmart Them: Summary of Kim Cramer Larsson talk May 14, 2025


Latest Comments