


It’s my birthday this month, so I’m looking at monthly candles: Not blowing them out though
Many markets this January have been a ‘Tale of Two Cities’ – or halves anyway. This has created a series of very interesting, and sometimes rare, single or two-candle patterns, reminding me of the song ‘Candle in the Wind’. Like the song’s lyrics, ‘’and it seems to me you lived your life, like a candle in the wind, never knowing who to cling to, when the rain set in’’. My gut instinct is to look carefully and special candles to see if they’ll give you a steer as to which way the wind is blowing.
Stock markets kicked off as bullish as they had been in Q4 2019, though volumes weren’t all that, some setting new record highs at, or just above, established long term trend channels. Then the coronavirus news broke and suddenly horns were drawn in. This month we’ll probably take one day at a time to see the extent to which this disease spreads.
Share prices in developed markets formed monthly shooting star type highs. My chart example of a single candle pattern is the S&P 500, which has similarities to a dragonfly doji. In this category we can lump together the Dow Industrial, Nasdaq, Toronto, Dax, Switzerland, Sweden, Russia and Amsterdam.
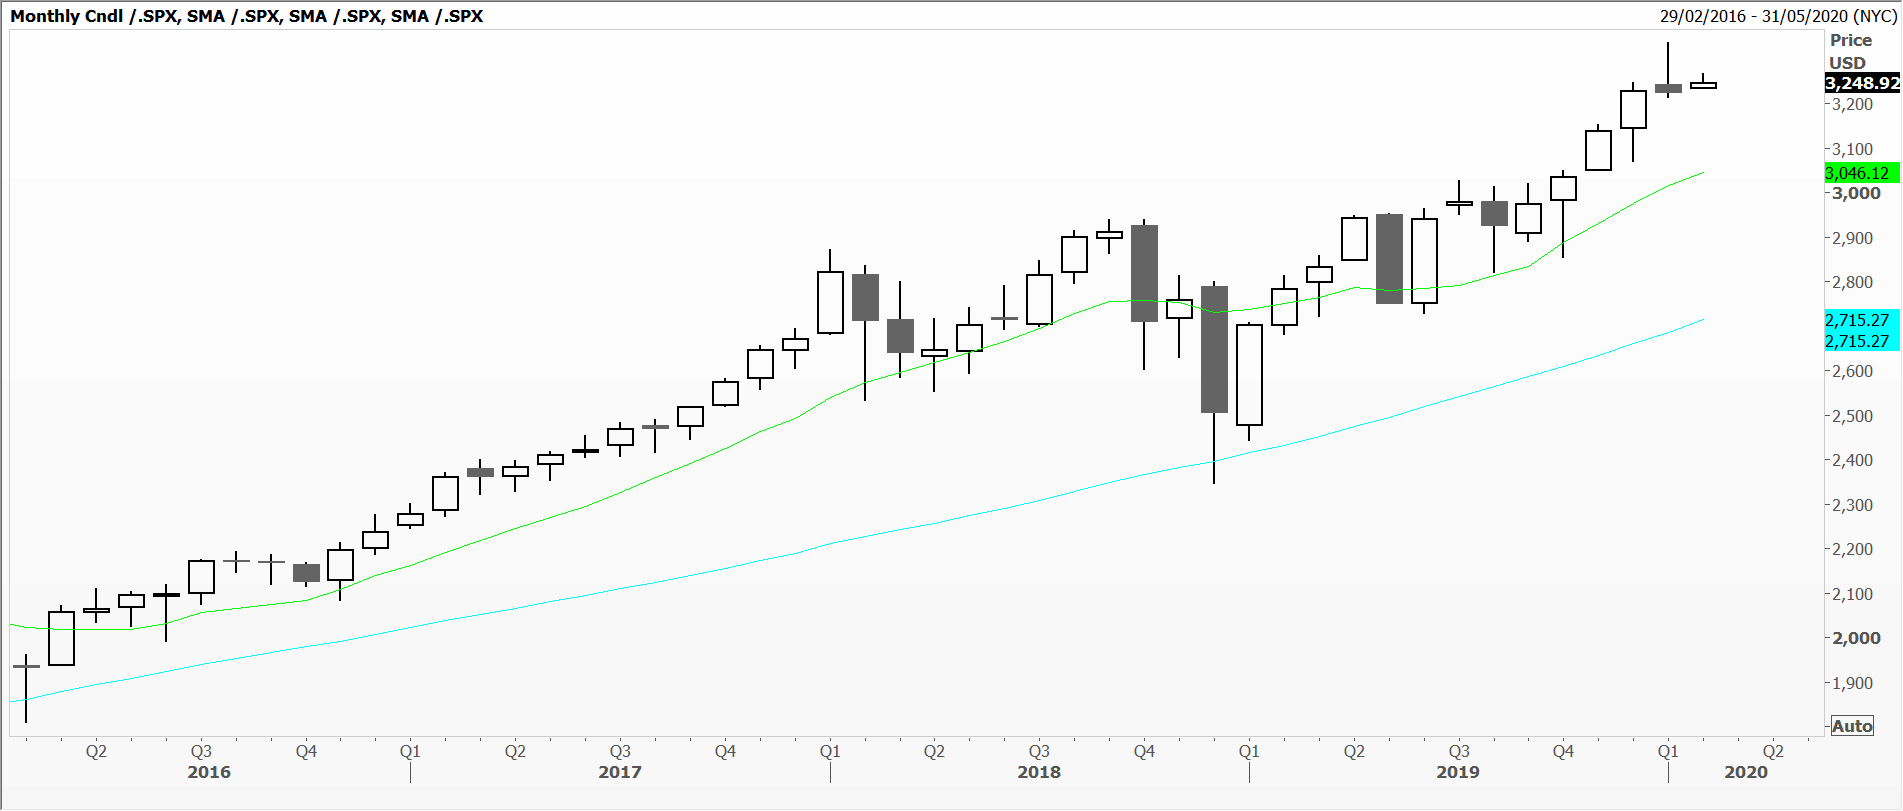
S&P 500 Single Candle Pattern
A second category are monthly (and weekly) charts with bearish engulfing two-candle patterns. Here we see FTSE 100, Spain’s Ibex, France’s CAC, Hang Seng, Jakarta, Russell 2000 and Dow Transports. The body of January’s candle is bearish and bigger than December’s.
Two Candle patterns
Other indices were once again rejected at established horizontal resistance levels, like Johannesburg and Mexico, South Korea and the Philippines.
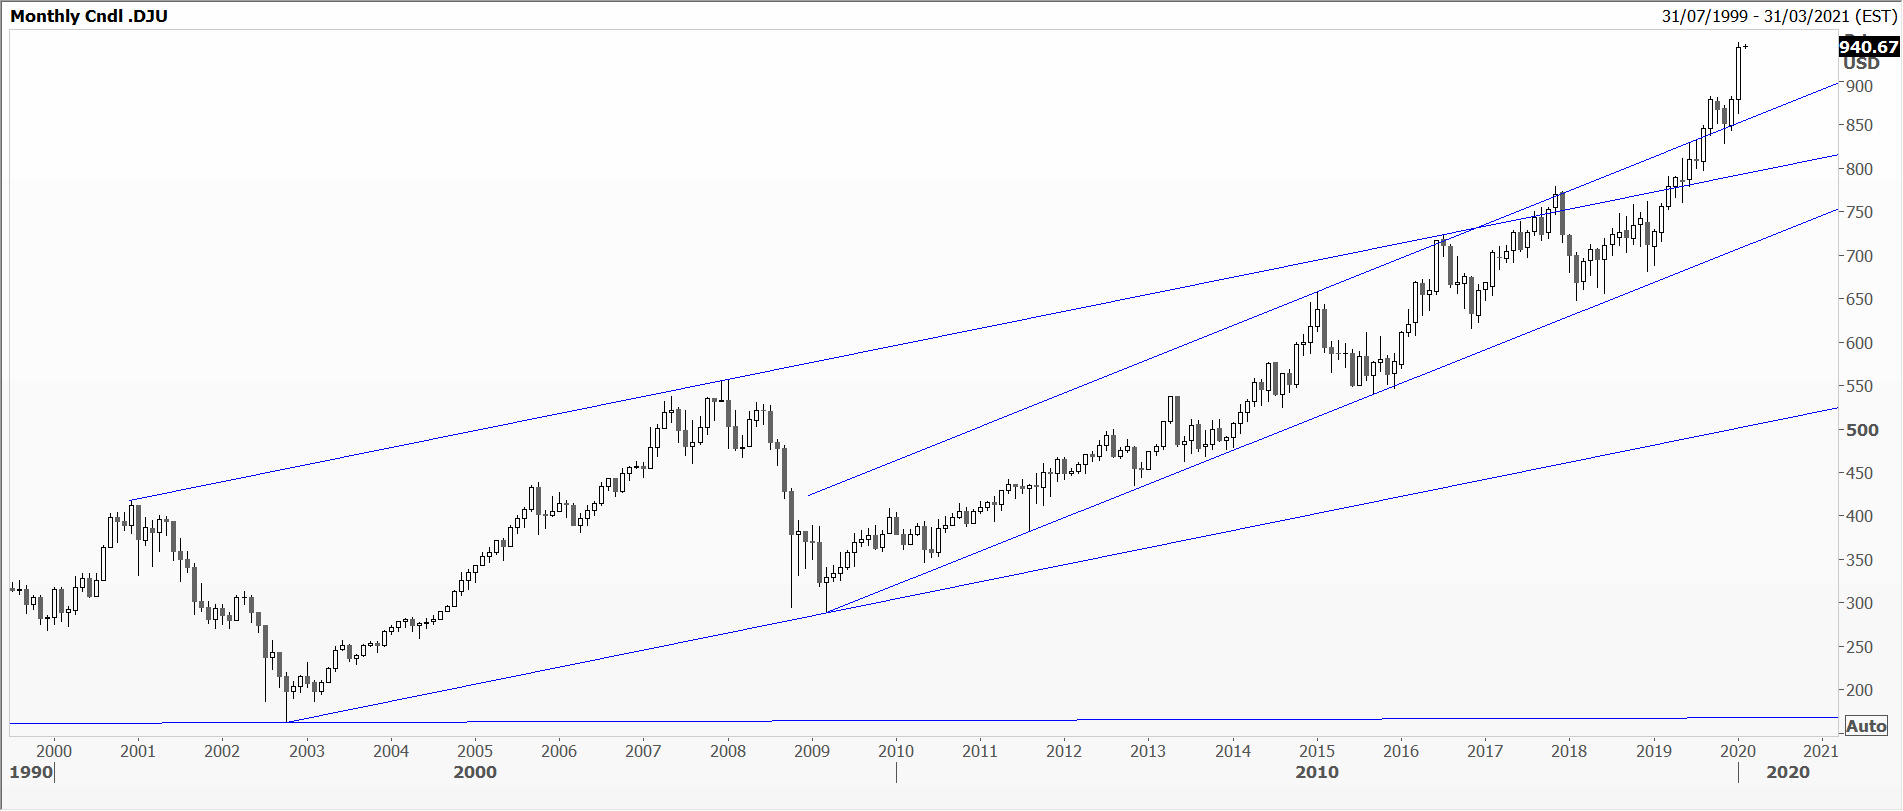
A very, very select few just kept on roaring higher all January, to form impressive bullish Marabuzo candles. The Dow Jones Utilities Average powered ahead, having built up bullish momentum over the previous four months, to a new record high. But then, this is really a fixed income product masquerading as a set of very large companies.
Biggest surprise of all was Australia’s All Ordinaries which, despite bushfire and brimstone, managed to at last take out November 2007’s then record high.
The views and opinions expressed on the STA’s blog do not necessarily represent those of the Society of Technical Analysts (the “STA”), or of any officer, director or member of the STA. The STA makes no representations as to the accuracy, completeness, or reliability of any information on the blog or found by following any link on blog, and none of the STA, STA Administrative Services or any current or past executive board members are liable for any errors, omissions, or delays in this information or any losses, injuries, or damages arising from its display or use. None of the information on the STA’s blog constitutes investment advice.


Latest Comments