


Is it a bull? Or is it a bear?
We all know that it takes opposing opinions to make a market; that prices will change as these shift, sometimes slowly, dramatically at other times. Brexit was perhaps a good example of received wisdom taking a real hit. Some suggest it takes a 20 per cent move in absolute price to signal that a new trend is underway.
This has been the case for spot gold, neatly managing a rally from $1060 to $1374 (29 per cent) this calendar year. It’s been the biggest and longest bull move since the final two months’ burst to the record high in 2011. Interestingly that move started at $1478, suspiciously close to this July’s peak, and also a 29 per cent move.
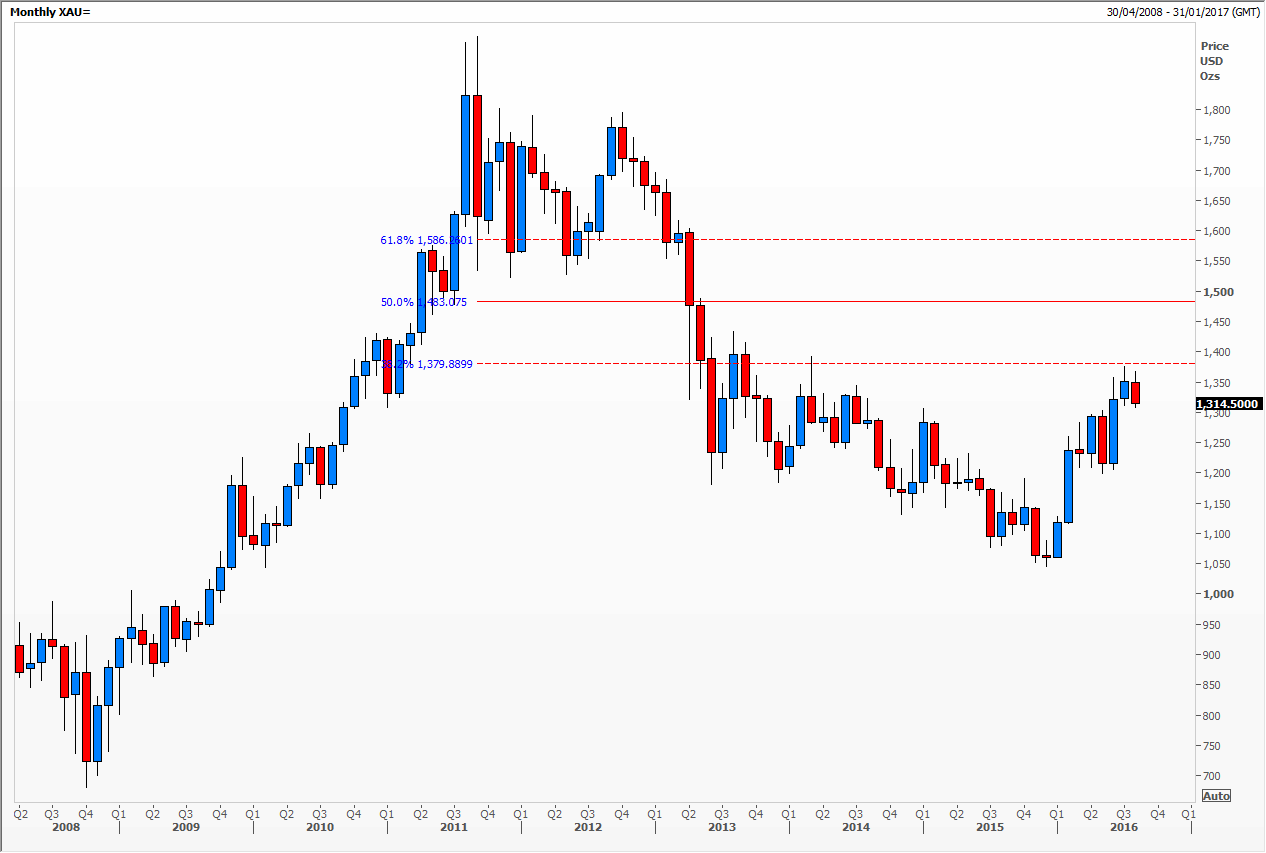
But can we say categorically that we are now in a secular positive trend? Not really as we have retraced just a Fibonacci 38 per cent of the declines since 2011. In other words, clearly in retracement mode and therefore the jury is out. What to do next?
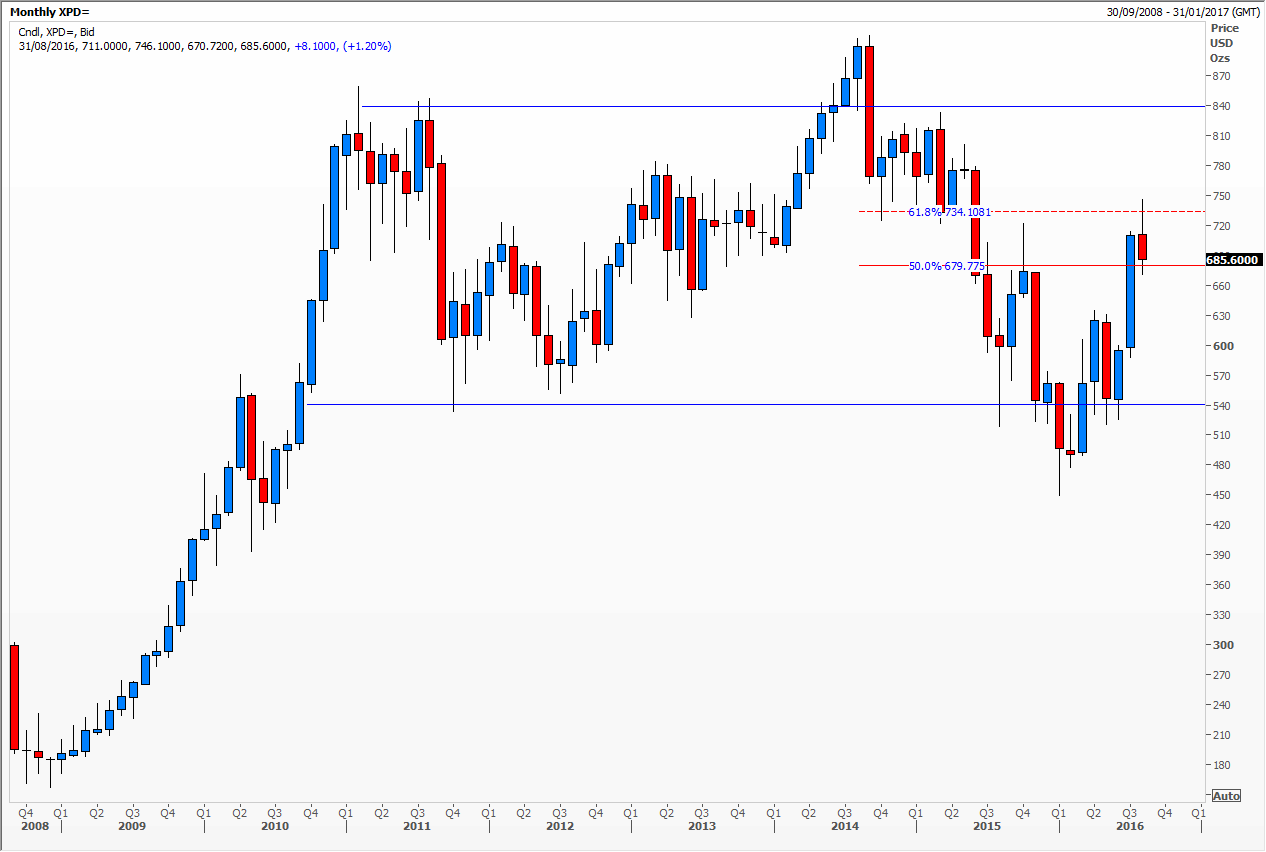
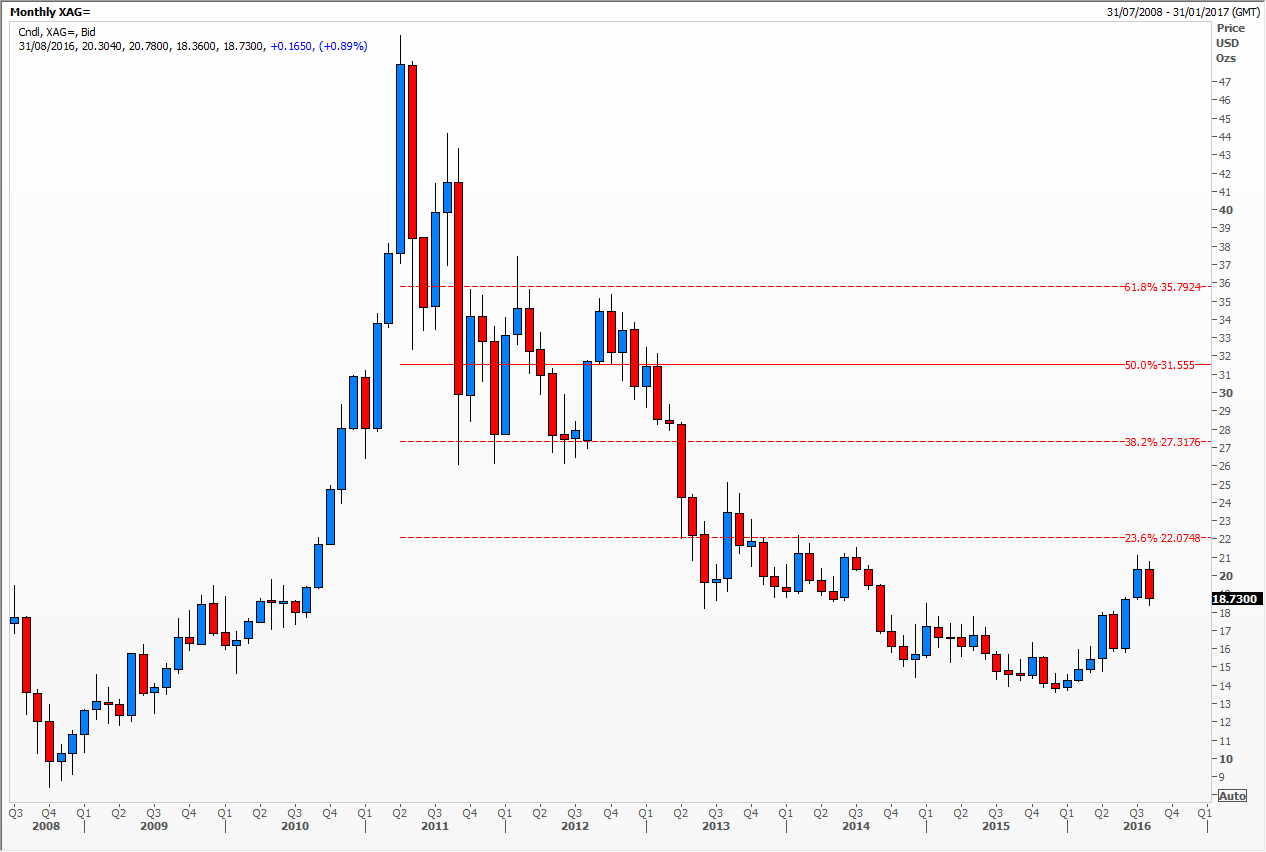
The first port of call is to look at similar and related instruments, in this case other precious metals which peaked in 2011. Platinum looks just like gold while silver has not even managed to recover 23.6 per cent of losses. Decidedly a bear, while palladium is completely different, trading very broadly sideways between $540 and $840 for six years.
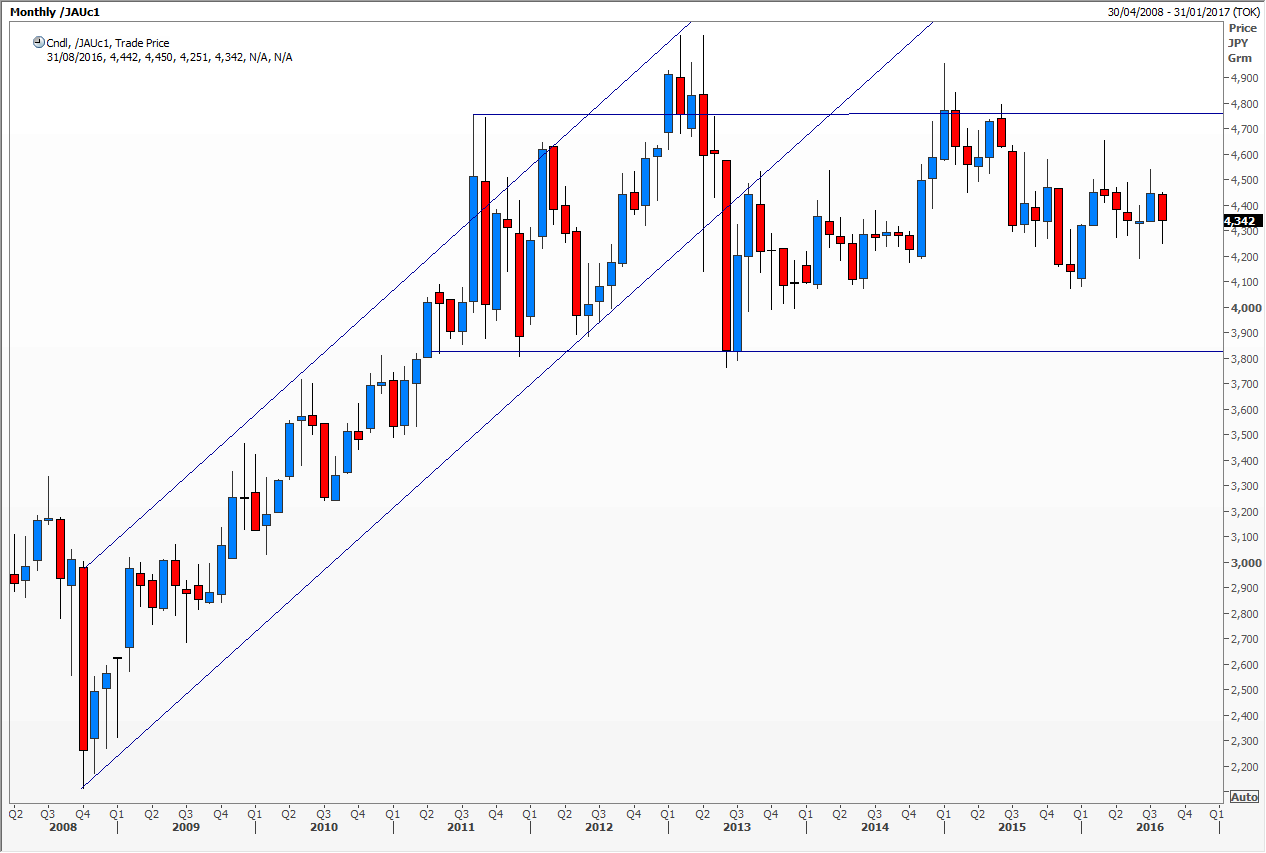
Another way to look at this is to strip out the currency effect (of a weaker then stronger US dollar). A refreshing way of looking at things, I sometimes like to surprise my audiences with this chart. It’s the price of a gram of gold, in yen, on the Tokyo futures exchange. Here you can see that the rally was strong and steady from 2008 all the way through to early 2013. Then it moves broadly sideways (like palladium) as PM Abe’s determination to weaken his nation’s currency affects prices.
If push comes to shove I’d probably have to say that gold is not, yet anyway, in fully blown bull mode.
Tags: gold, percentage moves, precious metals, time horizon
The views and opinions expressed on the STA’s blog do not necessarily represent those of the Society of Technical Analysts (the “STA”), or of any officer, director or member of the STA. The STA makes no representations as to the accuracy, completeness, or reliability of any information on the blog or found by following any link on blog, and none of the STA, STA Administrative Services or any current or past executive board members are liable for any errors, omissions, or delays in this information or any losses, injuries, or damages arising from its display or use. None of the information on the STA’s blog constitutes investment advice.


Latest Comments