


Ratios and spreads: Ways to compare
This week’s report by the Institute of Fiscal Studies into the difference between men and women’s pay was all too predictable and just as disappointing. Precious little progress in narrowing the gap not just in hourly pay, but promotion prospects and the problem of low pay rather than lack of employment.
It set me thinking about the many things we measure as a ratio, rather than an absolute, and the way we as technical analysts use spreads between asset classes. Credit spreads between junk bonds and investment grade; the difference in yield between bonds of longer versus shorter maturities; emerging market dividends versus mature market ones. To this mix we can add fund manager fees as a percentage to total returns, VAT as a proportion of price; tax base to GDP. The list goes on.
This is a traditional way of viewing things in commodity markets, especially where products are linked or can be substituted. The ‘crack spread’ which compares the price of crude oil to its products (gasoline, heating oil and naphtha); the soybean ‘crush’ (between beans, bean oil and mash). Wheat versus barley versus oats in the grain complex.
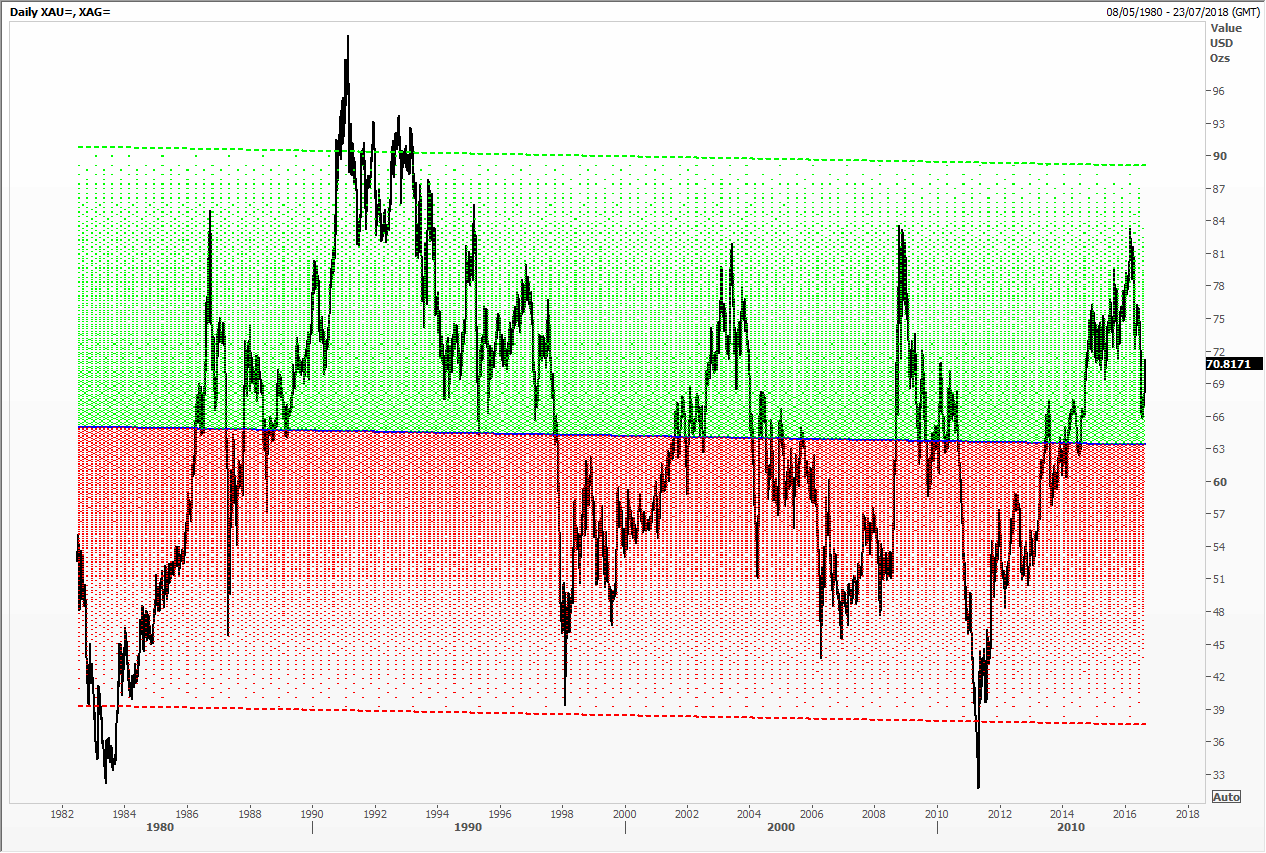
One that’s very popular is the ratio between gold and silver. How many ounces of silver do I need to pay for one of gold? You can see that over that last quarter of a century it has swung around wildly (and a pity the Bunker-Hunt debacle isn’t included on this chart), tripling at times. To get a sense of what’s more ‘normal’ we have added a mean regression plus two standard deviations around this.
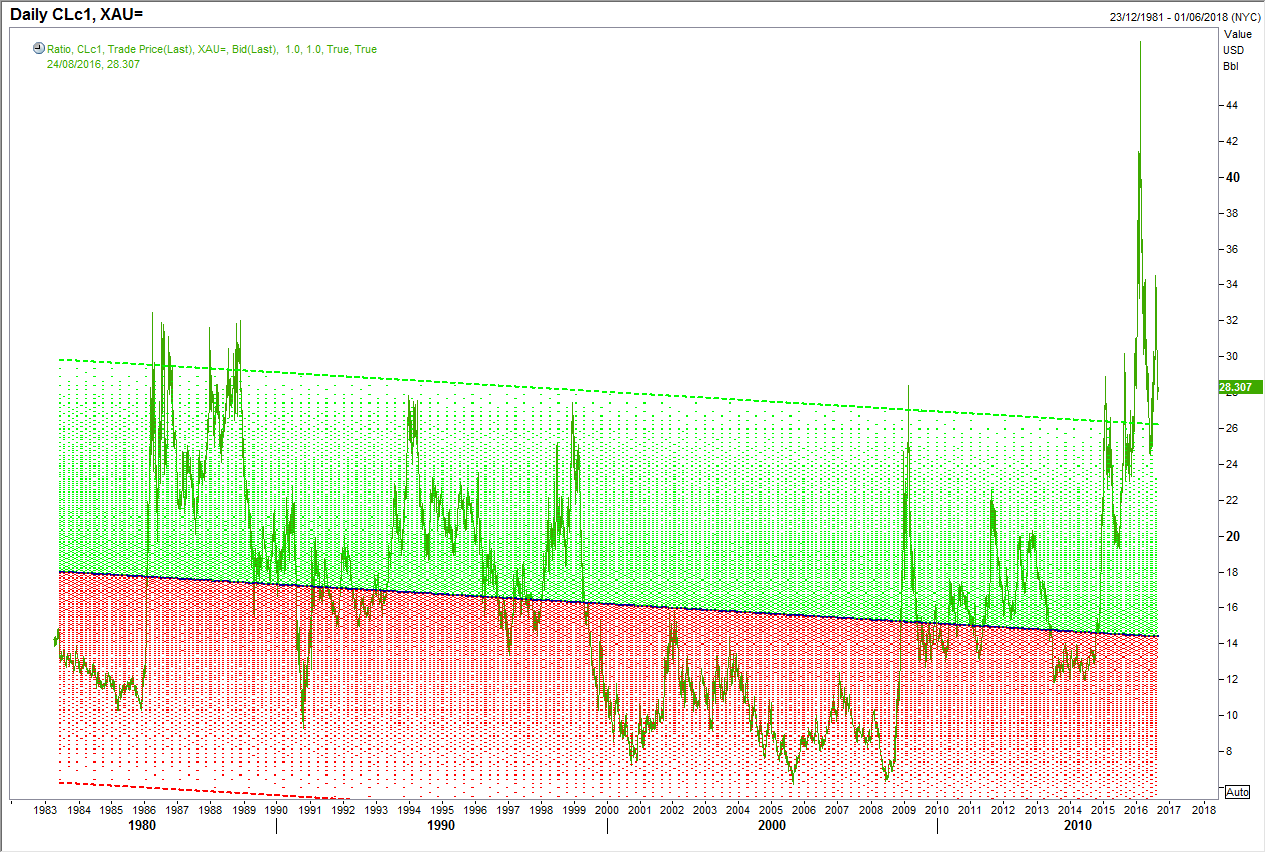
One that’s not quite so intuitively obvious is the ratio of how many barrels of crude oil (NYMEX on this chart) does one need to buy an ounce of gold; merely a way of seeing what’s expensive. Again regression and two standard deviations were added. I think you’ll agree that things got seriously out of kilter since Q4 2105 and that the secular trend is for oil to outperform ever so slightly.
Tags: differentials, Ratios, regression, Spreads
The views and opinions expressed on the STA’s blog do not necessarily represent those of the Society of Technical Analysts (the “STA”), or of any officer, director or member of the STA. The STA makes no representations as to the accuracy, completeness, or reliability of any information on the blog or found by following any link on blog, and none of the STA, STA Administrative Services or any current or past executive board members are liable for any errors, omissions, or delays in this information or any losses, injuries, or damages arising from its display or use. None of the information on the STA’s blog constitutes investment advice.


Latest Comments