


Holiday money: where to bag a bargain
School’s out for summer and for once the pound is stronger against the euro. This becomes immediately apparent as you walk past the bureau de change along the high street but the question is whether it’s the euro’s fault (and problem) or whether this is the case for other currencies too.
Too lazy to look at a dozen or more charts of different currency pairs, we search for shortcuts in order to determine which might be the most advantageous holiday destination this year.
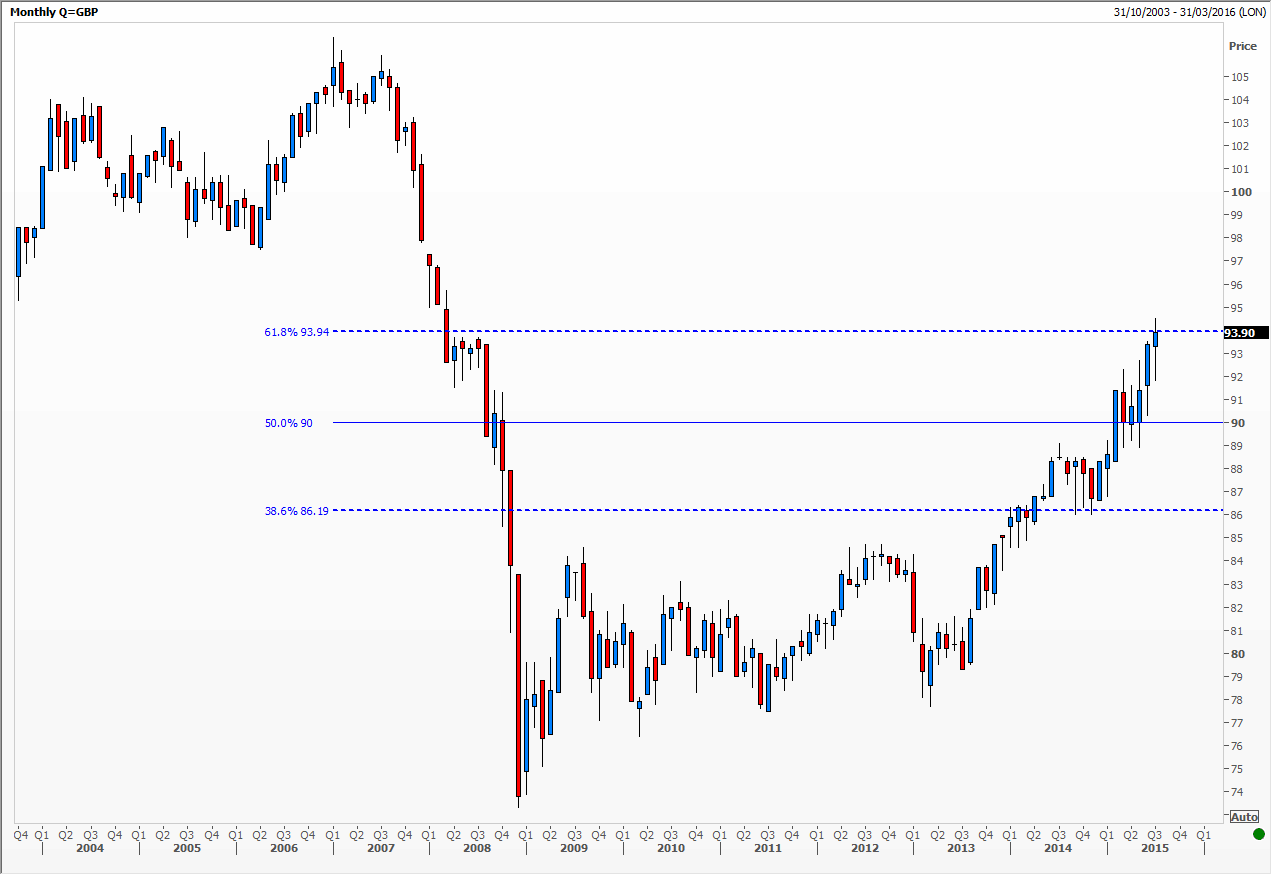
The first chart is of the Bank of England’s Trade Weighted sterling index. It aims to measure the value of the pound through bilateral exchange rates to assess the price competitiveness of traded goods and services with weightings reflecting trade flows. Countries measured include the USA, China, Australia, Canada, Switzerland, Japan and Europe, of course. One can see the catastrophic collapse in the value of the pound in 2007, down 27 per cent in just 12 months, as the impact of a looming financial crisis became apparent. Since steadying in 2010 it has now retraced a Fibonacci 61 per cent of prior losses – so not quite back to square one.
Another way to compare currency moves is by starting at a nominal 100 and plotting percentage changes over time. The trouble with this method for some is that in one’s mind one tends to associate certain digits to the value of an instrument, say the pound worth about 1.56 US dollars, or 122 Japanese yen per greenback. These become sort of icons and beacons to one’s view of value.
We have attached two charts going back over the last year plotting the value of sterling against major and emerging market currencies. Against the pound the Brazilian real is off by 31 per cent, New Zealand and Norway down by 20 per cent. Only the Swiss franc has appreciated over the period, by a mere 2 per cent. Or perhaps we should say, the pound has appreciated against all examples except the last. Points of view.
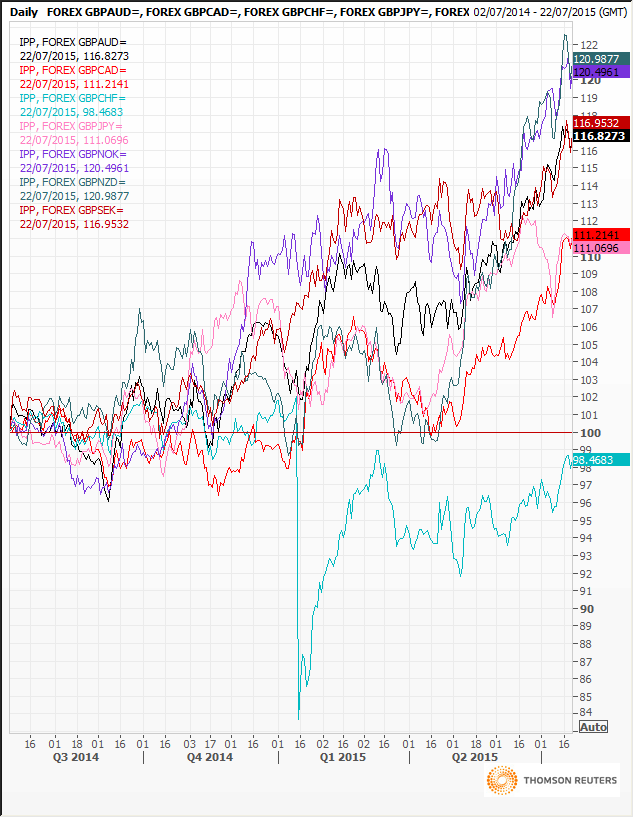
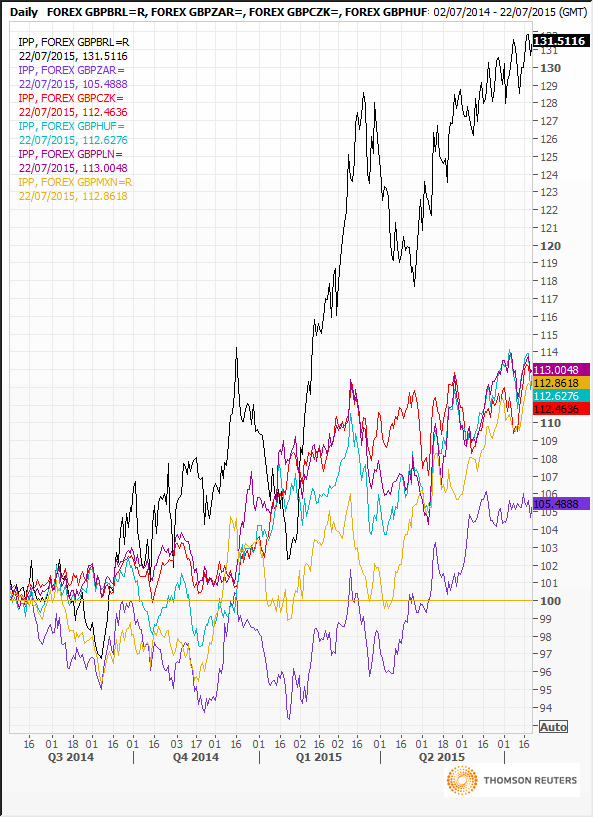
Obviously this type of chart lends itself to quick and clear measurement of baskets of financial instruments.
Tags: FX, per cent, relative strength
The views and opinions expressed on the STA’s blog do not necessarily represent those of the Society of Technical Analysts (the “STA”), or of any officer, director or member of the STA. The STA makes no representations as to the accuracy, completeness, or reliability of any information on the blog or found by following any link on blog, and none of the STA, STA Administrative Services or any current or past executive board members are liable for any errors, omissions, or delays in this information or any losses, injuries, or damages arising from its display or use. None of the information on the STA’s blog constitutes investment advice.


Latest Comments