


Colouring candles: Conventions and perception
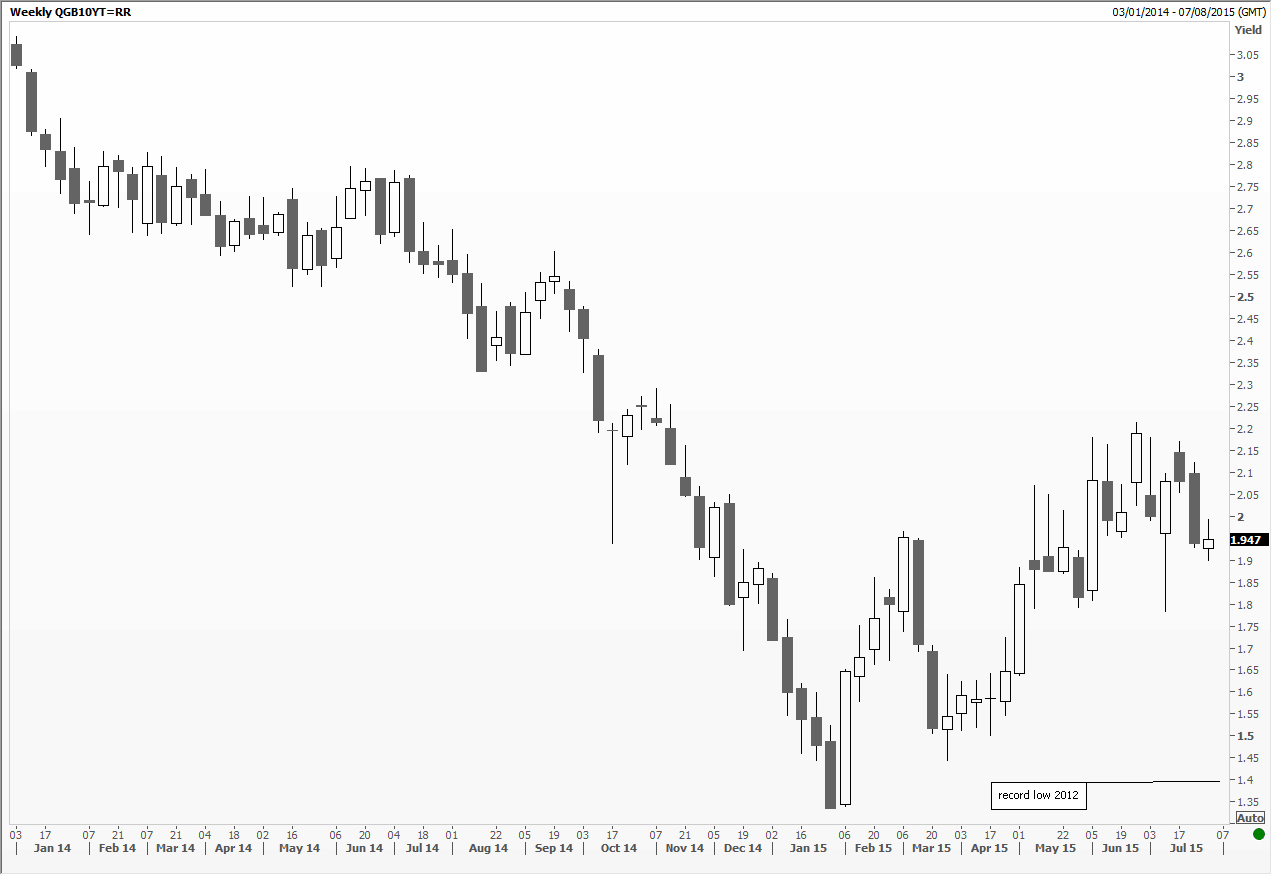
In the olden days charts were kept by hand. Graph paper was usually white, though sometimes pale green was preferred as it is said to be easier on the eye. Sharpened pencils at the ready the working day started and ended with careful drawing of bars and candles, the ability to rub out mistakes and redraw lines an essential tool resulting in rather dull grey on greyish charts.
Then the publishing industry realised the outsized profits available from printing weekly journals and selling them to investors, bankers and stockbrokers. Interestingly they too tended to stick to the grey tones though increasingly fine black pen was used to update manually until the next edition arrived in the post.
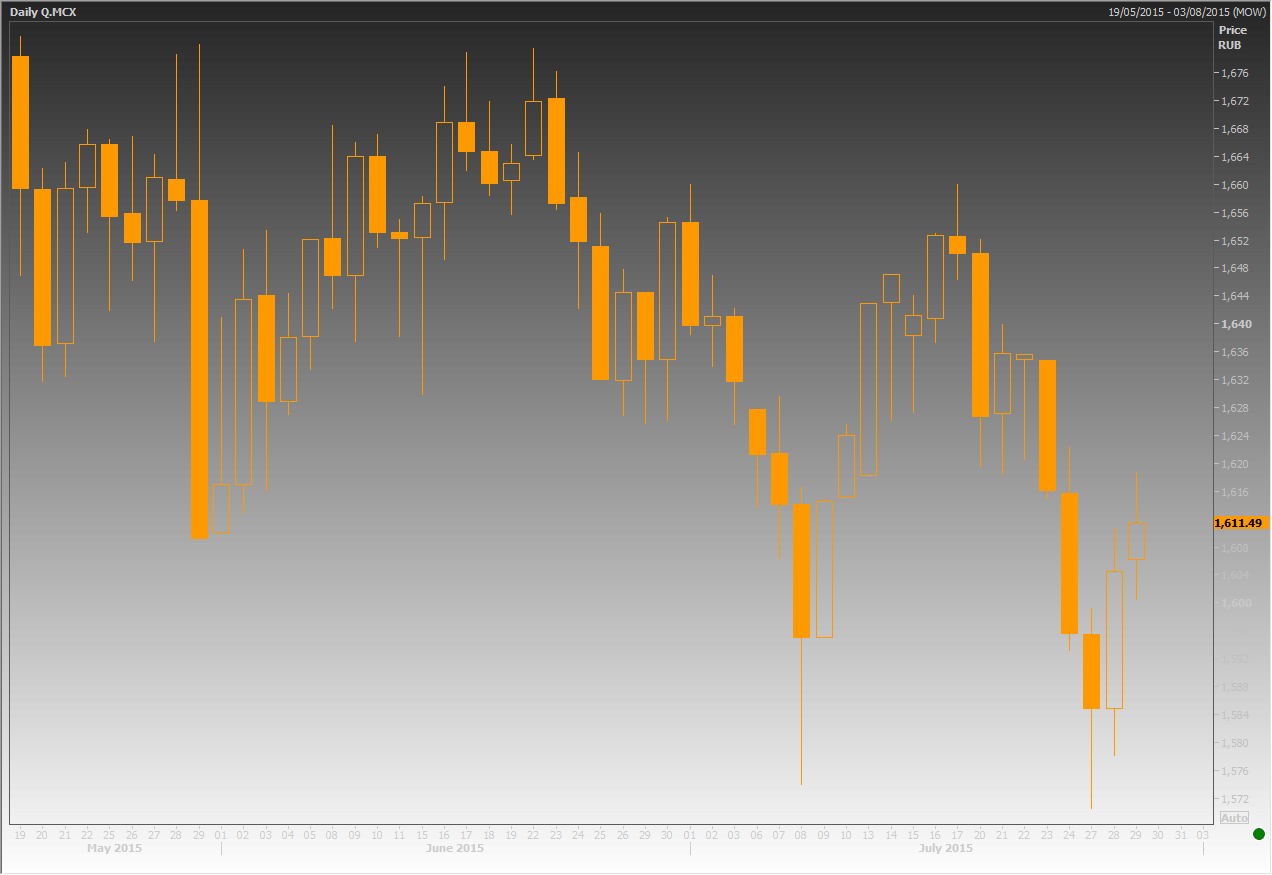
When computers and terminals caught up with technical analysis, they were often limited to a generic screen format of luminous green on a black background. Reuters’ FXFX page was one of the most widely used in treasury dealing rooms, with scrolling headlines along the bottom. Geek chic colour tones are still followed by Bloomberg, the range expanding to include a rather harsh orange and background colour gradations (popular in the Far East).
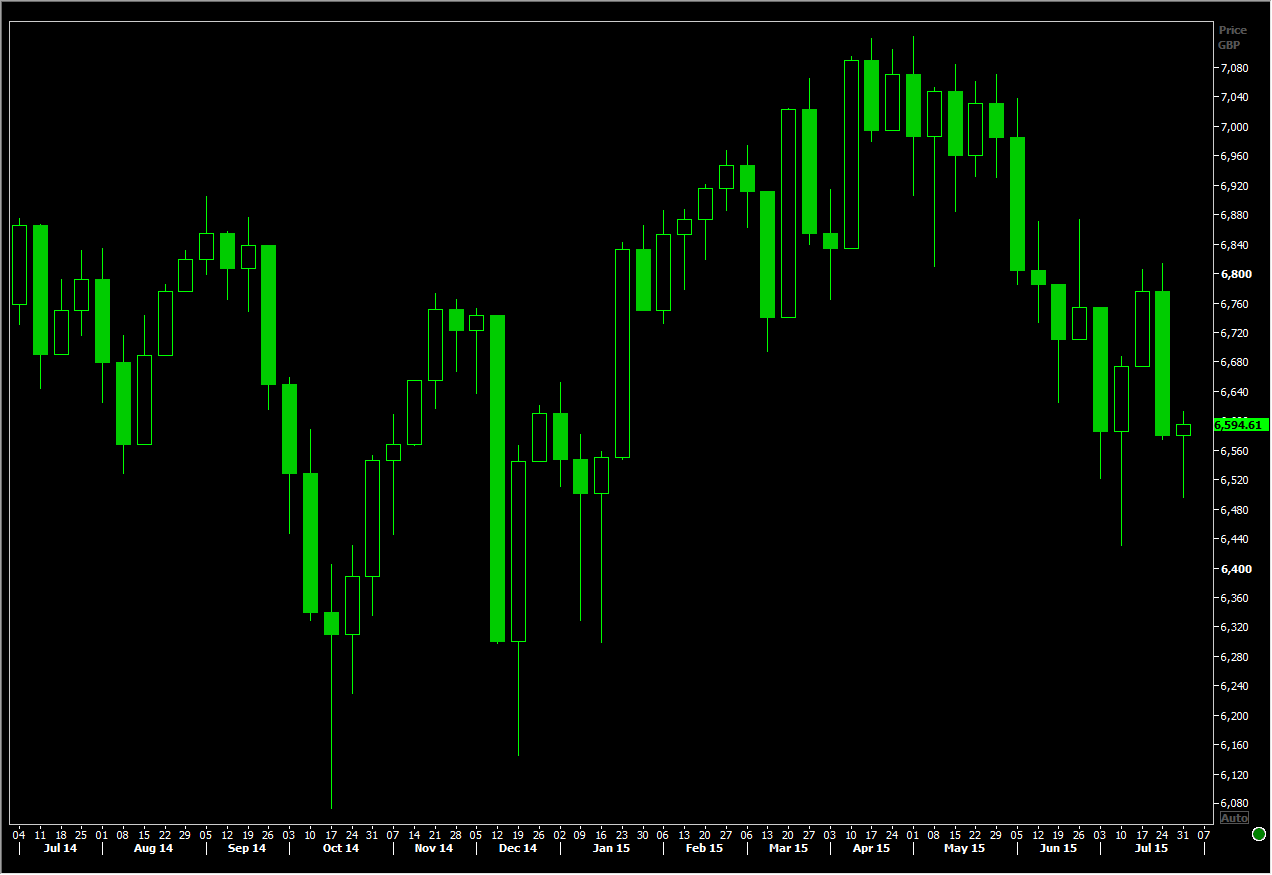
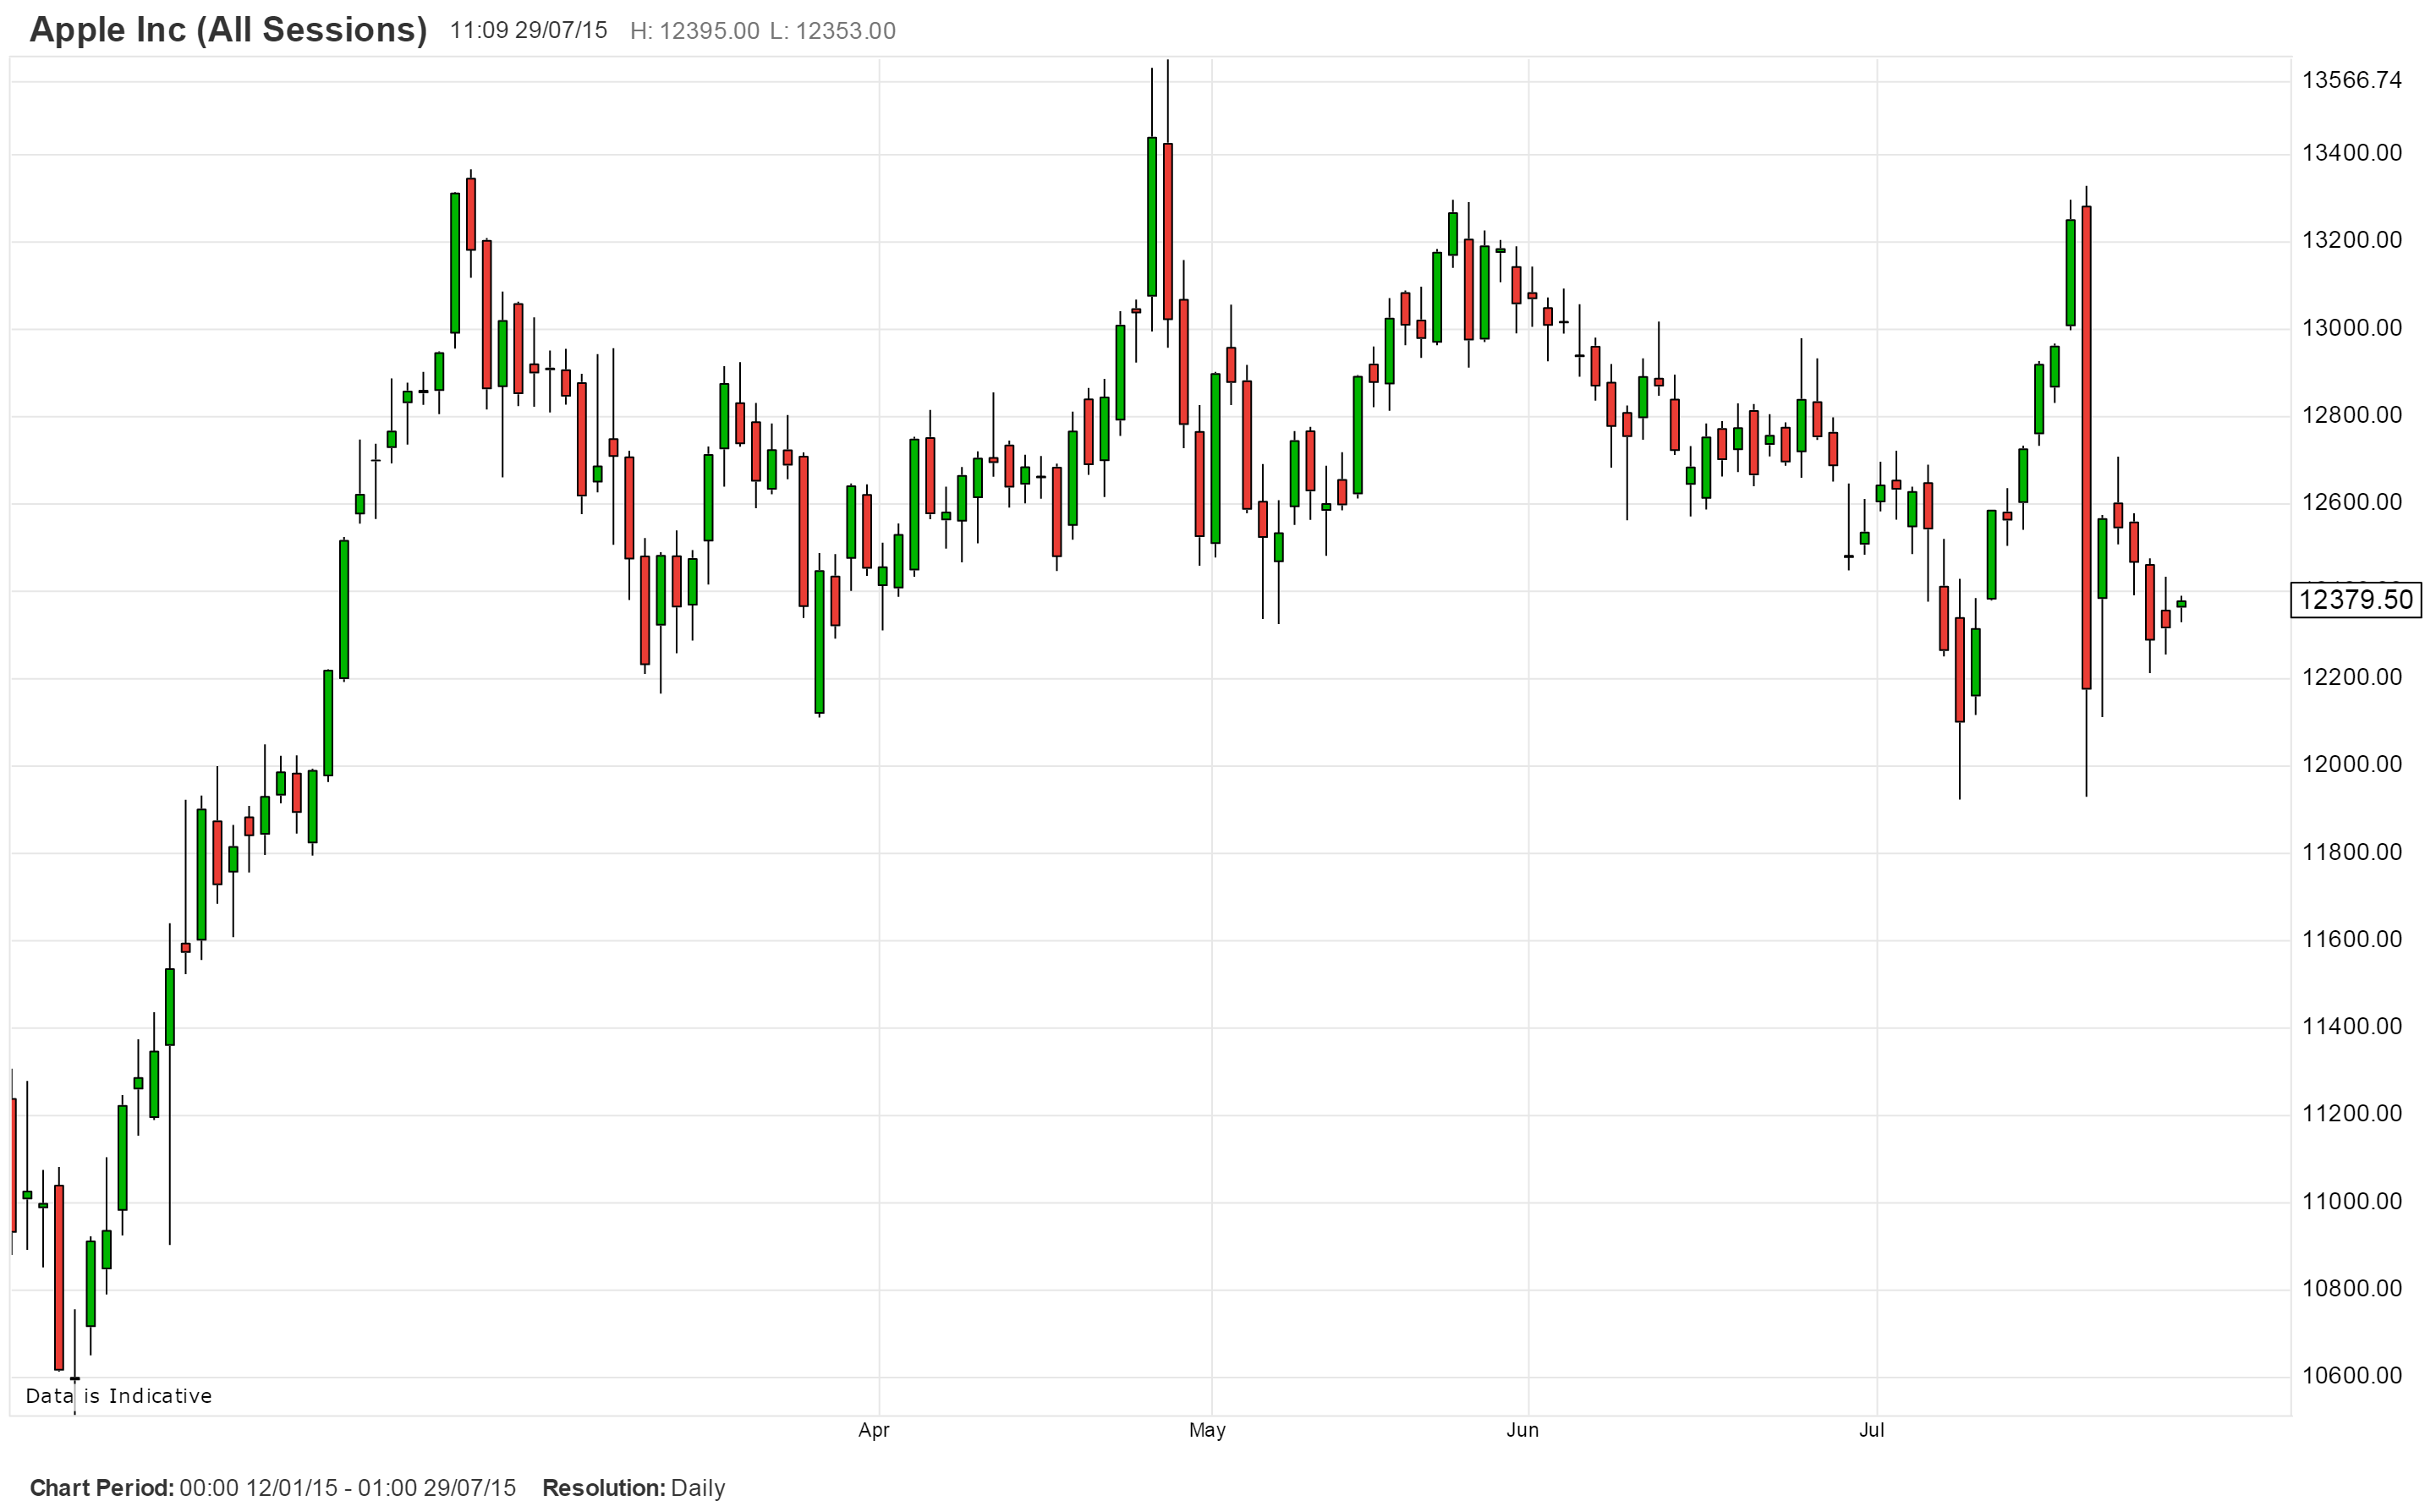
Stockbrokers also got involved and based on their conventions introduced the idea of green and red candles depending on whether the share had rallied or slumped that day. This has subsequently been adopted by many in the spread betting and FX trading communities.
Research from investment houses and banks will often incorporate elements of their logo, font, and colour scheme into documents published, both online and in hardcopy. If properly handled this can make for a very attractive presentation. However, care in the colour choices should be made when using many lines on one chart, like say Ichimoku clouds, especially when overlaid with Fibonacci retracements and trend lines.
Above all when analysing the charts personal display preferences must not be allowed to interfere with the technical analysis itself.
The views and opinions expressed on the STA’s blog do not necessarily represent those of the Society of Technical Analysts (the “STA”), or of any officer, director or member of the STA. The STA makes no representations as to the accuracy, completeness, or reliability of any information on the blog or found by following any link on blog, and none of the STA, STA Administrative Services or any current or past executive board members are liable for any errors, omissions, or delays in this information or any losses, injuries, or damages arising from its display or use. None of the information on the STA’s blog constitutes investment advice.


Latest Comments