Drawing the line: Correctly
The quickest and easiest way to establish a trend is by drawing a trend line, yet it is unbelievable and frightening how often these are done incorrectly. At the risk of being pedantic and accused of treating readers condescendingly, we remind how things ought to be done. We also make suggestions as to when and how to bend the rules.
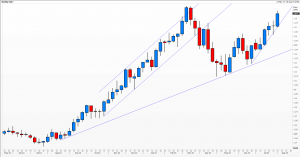
In a bull market a trend line must be drawn under the prices (bars, candles or line charts) and at least three points of contact must be made; the more the merrier and the stronger the signal when a break occurs. A parallel can be drawn above the prices creating a trend channel, a break of the upper line merely suggesting acceleration rather than anything more exciting. The narrower the trend channel, the stronger its validity and the signals it might generate; very broad bands are just that. The only time any old line can be drawn above prices in a bull market is when it forms part of a pattern, a triangle for example, and must not be labelled a trend line.
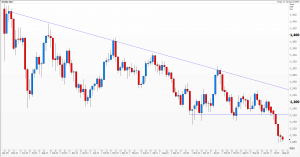
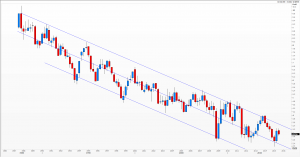
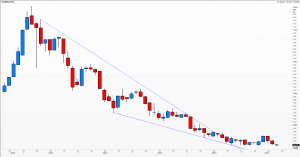
Conversely in a bear market all of the above are reversed and the same rules hold. The temptation to draw a semi-parallel line below prices is great – but incorrect – and is caused by the tendency for bear markets to end slowly and cautiously (creating a downward-sloping wedge pattern) while bull markets are more likely to end with a bang (like a shooting star) not a whimper.
An Andrews pitchfork consists of three parallel lines, a central one that hugs price action and two outer ones which attempt to capture most but not all of the extremes; points of contact do not apply rigorously here. Think of it like linear regression around which one, two, or other (1.6 perhaps?) standard deviation bands are drawn.
When you pl ot a line and don’t like the look of it, just keep on trying. I usually join the bodies of the candles and ignore the wicks as these are often spikes in the market, but then one must remember that only a close through the line constitutes a real break. Where a trend is slowing, draw several line segments that capture waning momentum – and acknowledge that it may not constitute a true break in trend. Finally, when nothing seems to work accept that there is no trend. The reality is that all too many markets spend most of their time meandering rather than trending.
The trend may be your friend, but often s/he is not around.
Charts Thomson Reuters
Tags: channel, pitchfork, Trends
The views and opinions expressed on the STA’s blog do not necessarily represent those of the Society of Technical Analysts (the “STA”), or of any officer, director or member of the STA. The STA makes no representations as to the accuracy, completeness, or reliability of any information on the blog or found by following any link on blog, and none of the STA, STA Administrative Services or any current or past executive board members are liable for any errors, omissions, or delays in this information or any losses, injuries, or damages arising from its display or use. None of the information on the STA’s blog constitutes investment advice.
Latest Posts
- Living in a land of large numbers: How to get a grip July 24, 2024
- Debate with ACI UK, The Broker Club & The Commodities Trading Club: Forecasts for the second half – plus marks for first half July 10, 2024
- Retail traders embrace volatility: Zero-day options and penny stocks on today’s menu June 24, 2024
- STA members and their guests get a dose of hypnotherapy June 12, 2024
- ‘And it’s a goal! Again’ Rectangles, corsets and straightjackets May 28, 2024


Latest Comments