


Halloween horrors: Or just a bit of a scare?
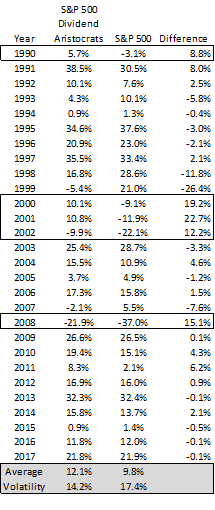
Earlier this month an STA member wrote to me suggesting I look the relative breadth of the US stock market because his proprietary model of US-Generating Factors had instigated sell signals in the Growth and Momentum subsets. Reminding us that E.S.C. Coppock, who first outlined his ideas in Barron’s magazine in 1962, considered his indicator suitable only for buy signals (hopefully at the bottom of the market), my pen friend pointed out that other sub-sets he looks at had generated buy signals over the last three months: Dividend Growth shares, Fundamental factors, High Yield stocks, Low Volatility and Quality shares.
Now, many newcomers to technical analysis are not au fait with Coppock, something I blame on this issue that sell signals have been subsequently cobbled together, and because the index is calculated only once, at the end of every month. Lazy-bones consider this a bonus because it not time consuming and also because storing data is not onerous. Fund managers like it because it can reduce the likelihood of whipsaws, and private investors follow it extensively because switching in and out of holdings is an expensive business.
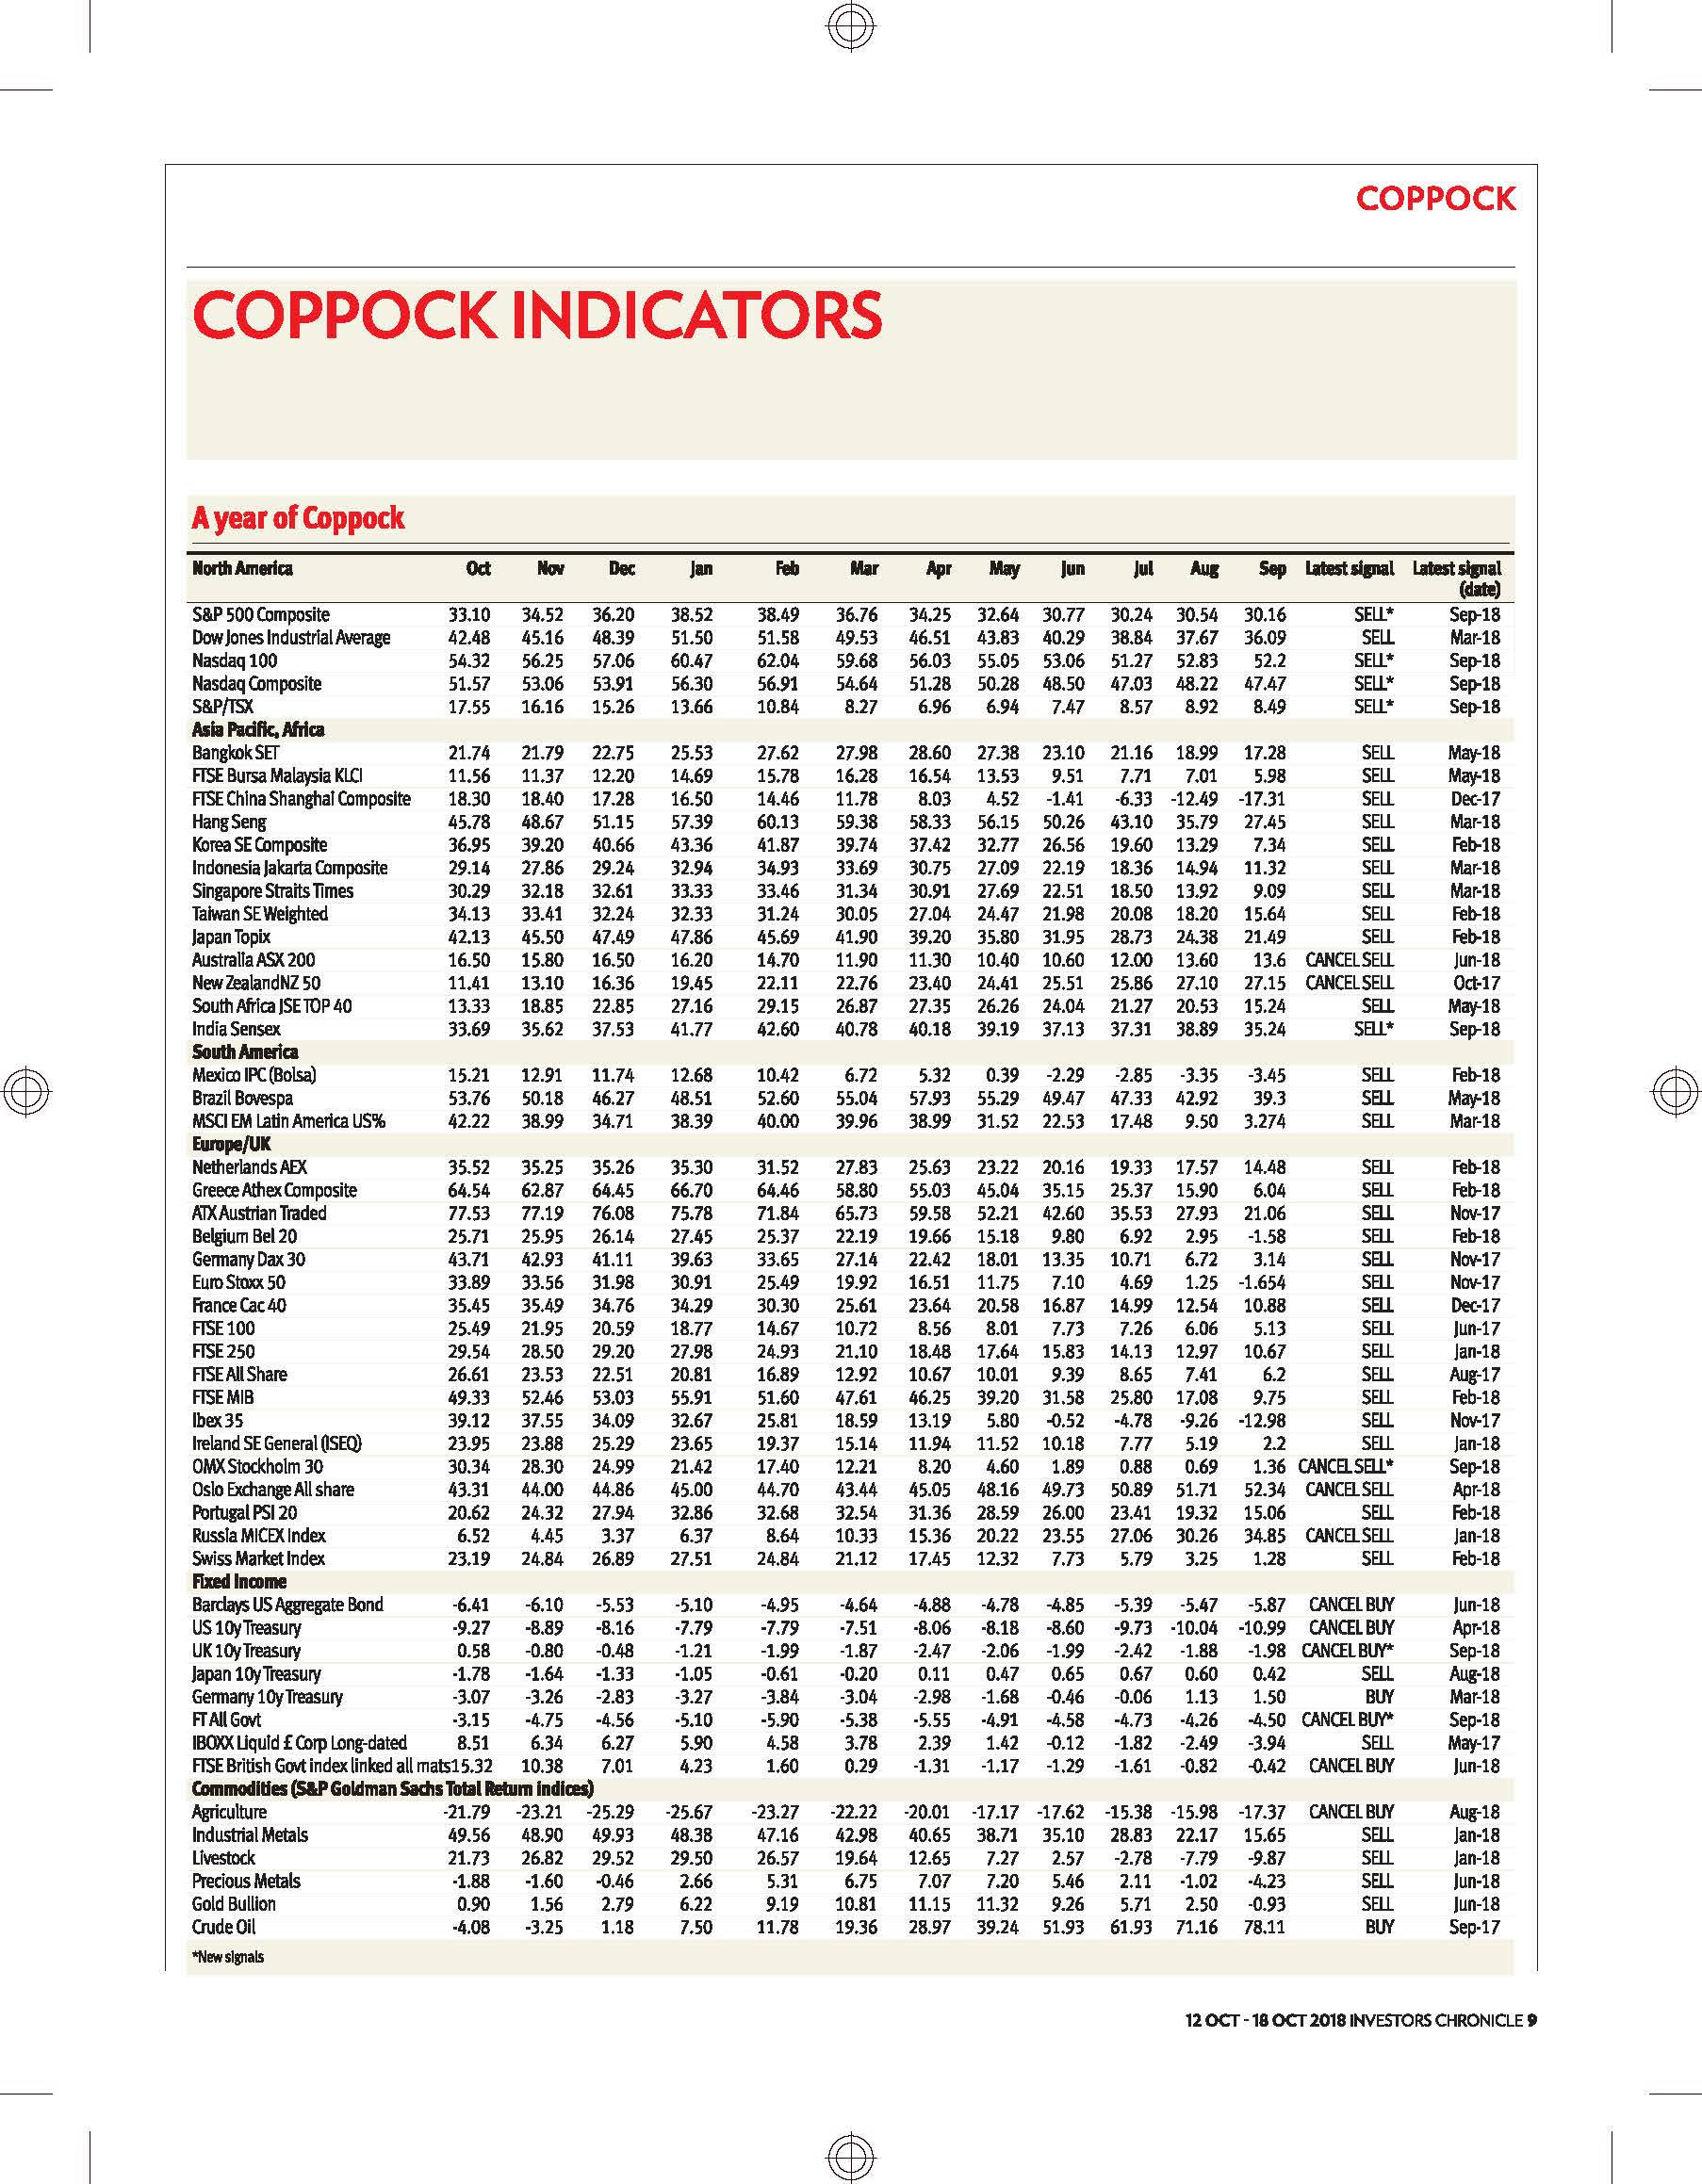
Investors Chronicle magazine, where I have a regular column and daily email, publishes modified Coppock results for a plethora stock indices, bonds and commodities. Editor John Hughman, who readily admits he doesn’t understand technical analysis, keeps a close eye on the buy, sell and cancel signals it generates. I’m not exactly sure when results for the month of October will be published, but do keep an eye out over the next few Fridays when new issues will be on news stands.
If this has whet your appetite but you can’t quite remember how Coppock works, a quick reminder: Using monthly data it is a 10-period weighted moving average of the sum of the 11 and 14-month rates of change in the index; think smoothed acceleration versus deceleration. It’ll swerve around the zero line, buy signals kicking in when, after being below zero, the oscillator turns positive.
I attach the Investors Chronicle table of Coppock indicators for the last year, and a smaller table of the so-called S&P 500 Dividend Aristocrats since 1990. After a rather turbulent October, the data might steady your nerves. Or maybe then again, dig a deeper hole.
The views and opinions expressed on the STA’s blog do not necessarily represent those of the Society of Technical Analysts (the “STA”), or of any officer, director or member of the STA. The STA makes no representations as to the accuracy, completeness, or reliability of any information on the blog or found by following any link on blog, and none of the STA, STA Administrative Services or any current or past executive board members are liable for any errors, omissions, or delays in this information or any losses, injuries, or damages arising from its display or use. None of the information on the STA’s blog constitutes investment advice.


Latest Comments