


Gold conundrum Can psychology help?
This year I’ve found charting gold very difficult indeed. Not so impossible that I begin to doubt my abilities as a technical analyst, but hard enough to warrant a lot of head scratching, caution with my forecasts, and to remind myself that this sort of thing has happened before. Funnily enough it was also with spot gold in the mid-1980’s and again in the 1990’a when I kept trying to pinpoint a long term base.
Not that I’ve been completely wrong-footed. I spotted the rounded bottom in January 2016, predicted a corrective bounce from there, than a potential broadening top April to June – and the nightmare started. I’ve re-drawn long term trend lines, re-thought patterns, checked oscillators and added more of them (just in case!)
In the process I stumbled upon a new one for me. Simply labelled a ‘psychology’ indicator (Metastock) I wondered if it might be a rough a ready reckoner and simple introduction to this vast subject on trading.
The formula is so simple it sounds silly: watch to see if the current close is above the previous one and if it is, give it a value of 1. Equal and lower closes than the day before are marked 0. Over the period these are summed up and the percentage of times a higher close was observed, calculated.
Therefore, its limits are 0 and 100, anything below 25 meaning investors are getting too bearish and above 75 too euphoric. Very similar to the RSI’s levels which also send out similar warning signals. Like so many oscillators it’s looking for a change in trend.
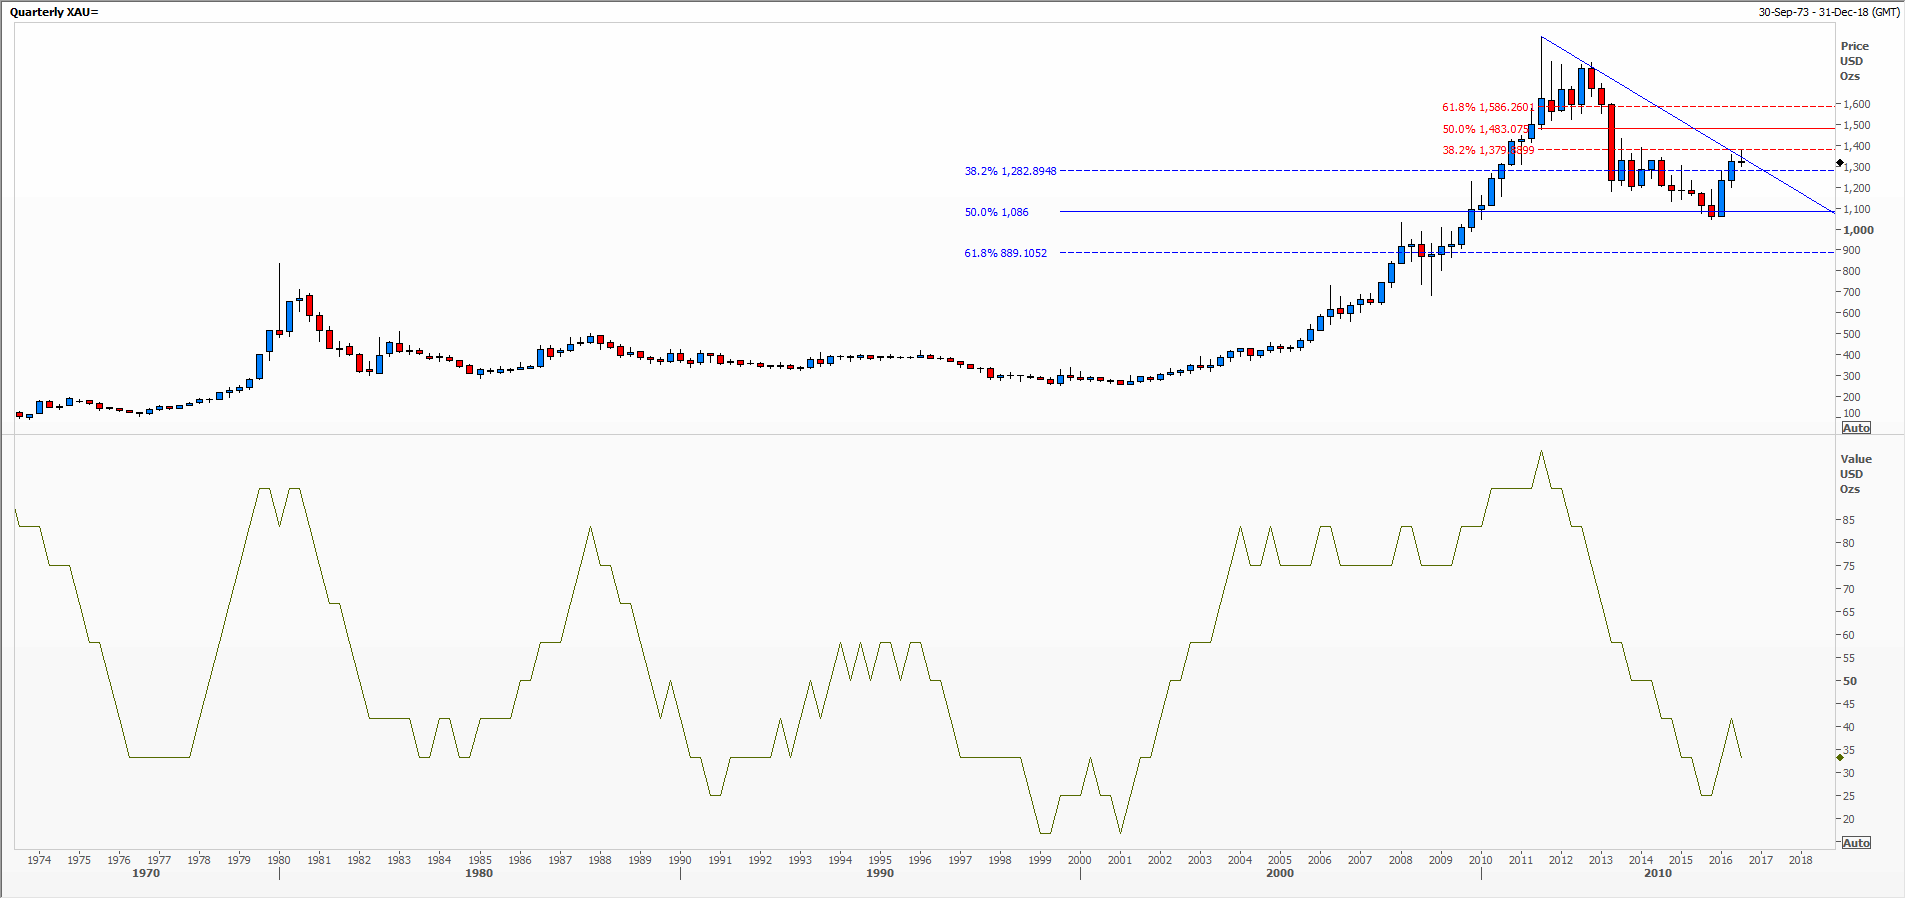
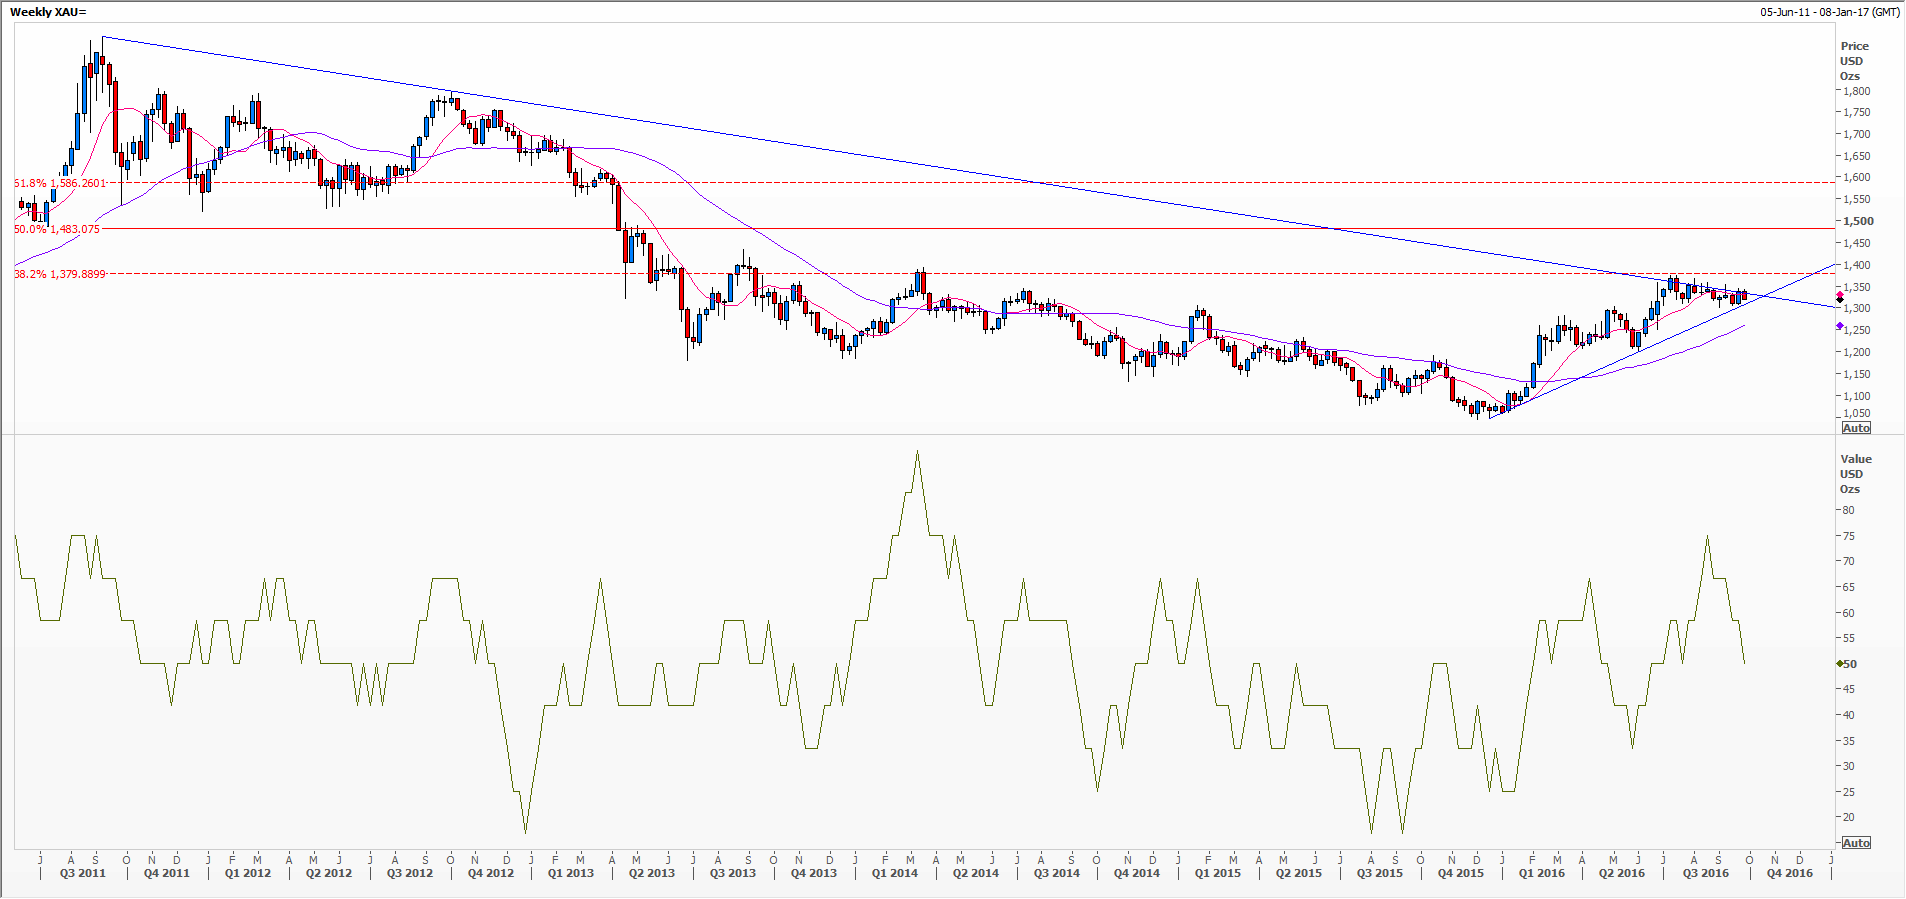
I’m going to watch to see how I get on with this new toy (for me). I like the simplicity and it should back up other well-known mathematical equations used by technical analysts. I attach a weekly chart (including 50 and 200 day moving averages) and a quarterly one (with Fibonacci retracements) for you to judge how it has fared over the medium and very long term.
Do please let us know whether you’ve worked with this and whether it’s worth pursuing.
Tags: extremes, oscillators, percentages, Psychology
The views and opinions expressed on the STA’s blog do not necessarily represent those of the Society of Technical Analysts (the “STA”), or of any officer, director or member of the STA. The STA makes no representations as to the accuracy, completeness, or reliability of any information on the blog or found by following any link on blog, and none of the STA, STA Administrative Services or any current or past executive board members are liable for any errors, omissions, or delays in this information or any losses, injuries, or damages arising from its display or use. None of the information on the STA’s blog constitutes investment advice.


Latest Comments