


The Fibonacci Numerical Sequence and Golden Ratio
An introduction to the Italian mathematician, Leonardo Fibonacci (circa 1170-1250), will be dispensed with as the man is less relevant to this article than what he documented in his 13th century book Liber Abaci: namely his discovery of the Hindu number sequence for which he is famously associated. The sequence itself is easily obtained by performing a small calculation: starting with 0 and 1, then adding the last two numbers in the sequence to create the next one, repeating this step ad infinitum. We end up with: 0, 1, 1, 2, 3, 5, 8, 13, 21, 34, etc.
So what’s so important about that? Not a lot. It is well known that, as the sequence extends, the ratio of one number to the next approximates 0.618, meaning that each number is 61.8% of the following number. However, this is also true of any pair of digits we might choose to start with. As an experiment, pick any two random numbers and repeat the small calculation. The result will be the same, converging to 0.618, the famous Golden Ratio. That’s the key.
The sequence isn’t important but the ratio is and it appears in many other situations. For example, the ratio of an average leaf’s width relative to its length; the circumference of an average droplet of water relative to its height; the height of any fish relative to its length; the distance between an average man’s foot and his or her navel relative to total height. The most famous example is the nautilus shell where the cross-sectional area increases by the same ratio as the spiral extends (with a growth bias).
Why is this and, more importantly, what does it have to do with trading and investments? I believe that it concerns overall efficiency and the conservation of energy. By forming these shapes, nature saves energy whilst enabling growth and expansion, making the most of available, but finite, resources.
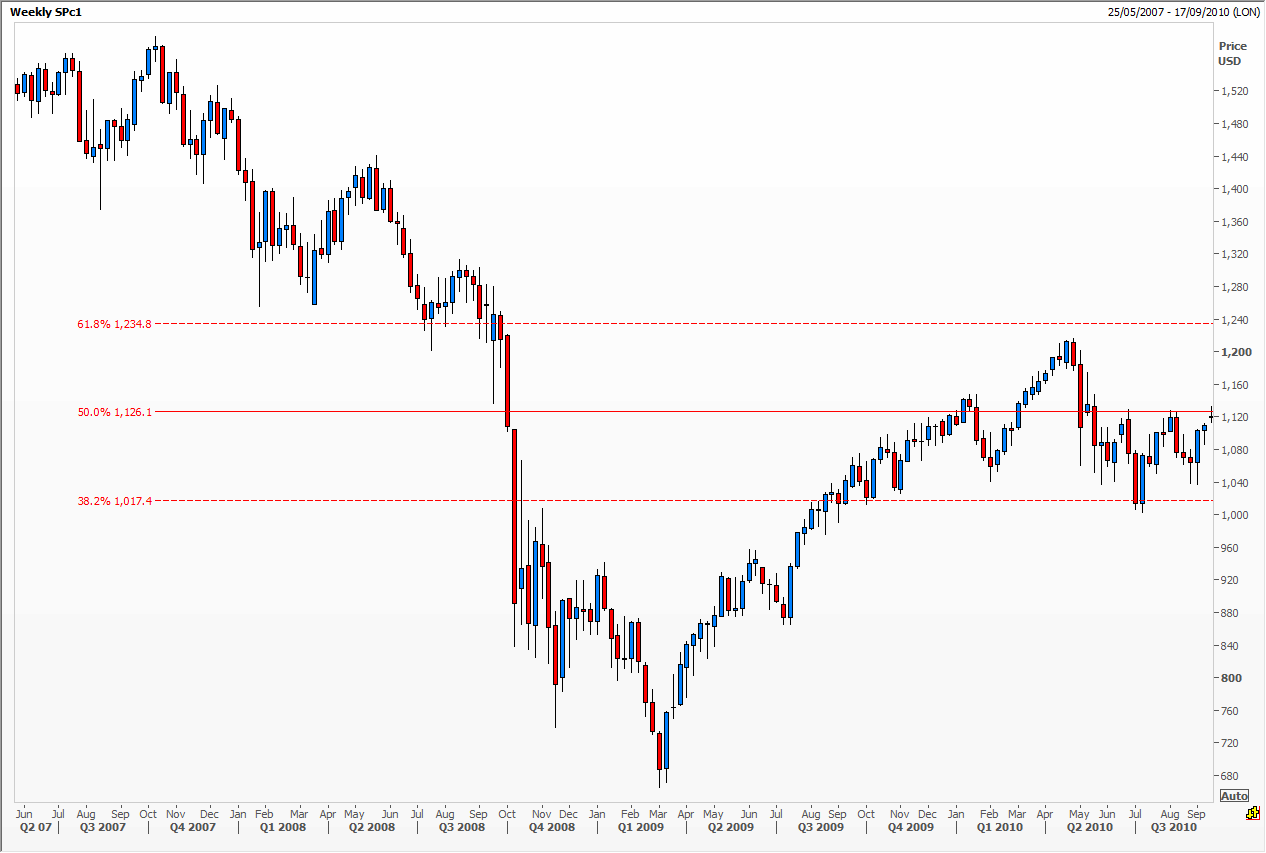
What does it have to do with trading? All the examples above are formed as a result of averages contained within large volumes of data. Collective behaviour. The average human, the average leaf, the average fish. When we start to look at trading we’re similarly looking at averages formed by the collective behaviour of large numbers of individuals. If we focus on, say, an index (e.g. the S&P 500) we can absolutely see this behaviour clearly as the indices’ prices are, by definition, not only formed by large volumes of trading individuals, the indices themselves are composites formed by a large number of corporations. We see averages reflected in their trading activity. The effect is easily observed by this one example; take a note of the monthly S&P 500 at its pre-crash November 2007 high against it’s post-crash March 2009 low and then note the price at which the next major retracement, in May 2010, starts. This retracement starting-point’s price is 62% of the value of the difference between the November 2007 high and the March 2009 low. There are many, many, other similar examples of varying time frames.
How can we apply this to trading? A good starting point would be to look at the extreme highs and lows of an index and then observe the behaviour as the price nears a Fibonacci ratio (38.2%, (50%), or 61.8%). Depending upon where the price is located, within a trading or Dow cycle, one would expect to observe a retracement. I would advise you to perform more research than I have given in this brief article as it is a vast topic and there are numerous and specific methods to refine and assist a Fibonacci trading strategy. This can only help to improve the estimation of which one of the ratios are likely to work at the location of the instrument’s price within its own cycle.
By Chris Fox MSTA
With thanks to; Constance Brown’s Fibonacci Analysis, is a superb and Malcolm Blazey.

The views and opinions expressed on the STA’s blog do not necessarily represent those of the Society of Technical Analysts (the “STA”), or of any officer, director or member of the STA. The STA makes no representations as to the accuracy, completeness, or reliability of any information on the blog or found by following any link on blog, and none of the STA, STA Administrative Services or any current or past executive board members are liable for any errors, omissions, or delays in this information or any losses, injuries, or damages arising from its display or use. None of the information on the STA’s blog constitutes investment advice.


Latest Comments