


Emerging markets and growing pains: None invited to next week’s G7 meeting in Cornwall
The countries which make up the G7 ( Canada, France, Germany, Italy, Japan, United Kingdom and USA) have met each year since the 1970s. The 2021 summit will be the 47th meeting to take place and the first to be held in the UK since 2013, this time in Cornwall between the 11th and 13th of June. The group used to be known as the G8 until Russia was expelled in 2014 over its annexation of Crimea. And why hasn’t China, the second biggest economy in the world, been invited?
Note to self: they are really meeting, not virtually and none of this video conferencing stuff for these supreme leaders. Plus a nice place and a great time of year to be in the West Country. Meanwhile the likes of you and I have 12 paltry international holiday destinations to choose from, including the Falkland Islands and South Georgia which are currently in full-on Antarctic winter mode.
So labels like G7, G10 and G20 really mean: us versus the rest. Many countries of the world do not have fully convertible currencies, some operate a fixed peg to the US dollar (Hong Kong and Saudi Arabia), are others are subject to sudden devaluations and regular periods of weakness.
Comparing this disparate group, which despite economists’ preference for lumping them under a catchy headline (think BRICS), make careful scrutiny difficult. One way to get round this problem is to measure percentage moves over a fixed time frame. The two charts for this piece do that, starting at the very beginning of this calendar year and plot each exchange rate move until today.
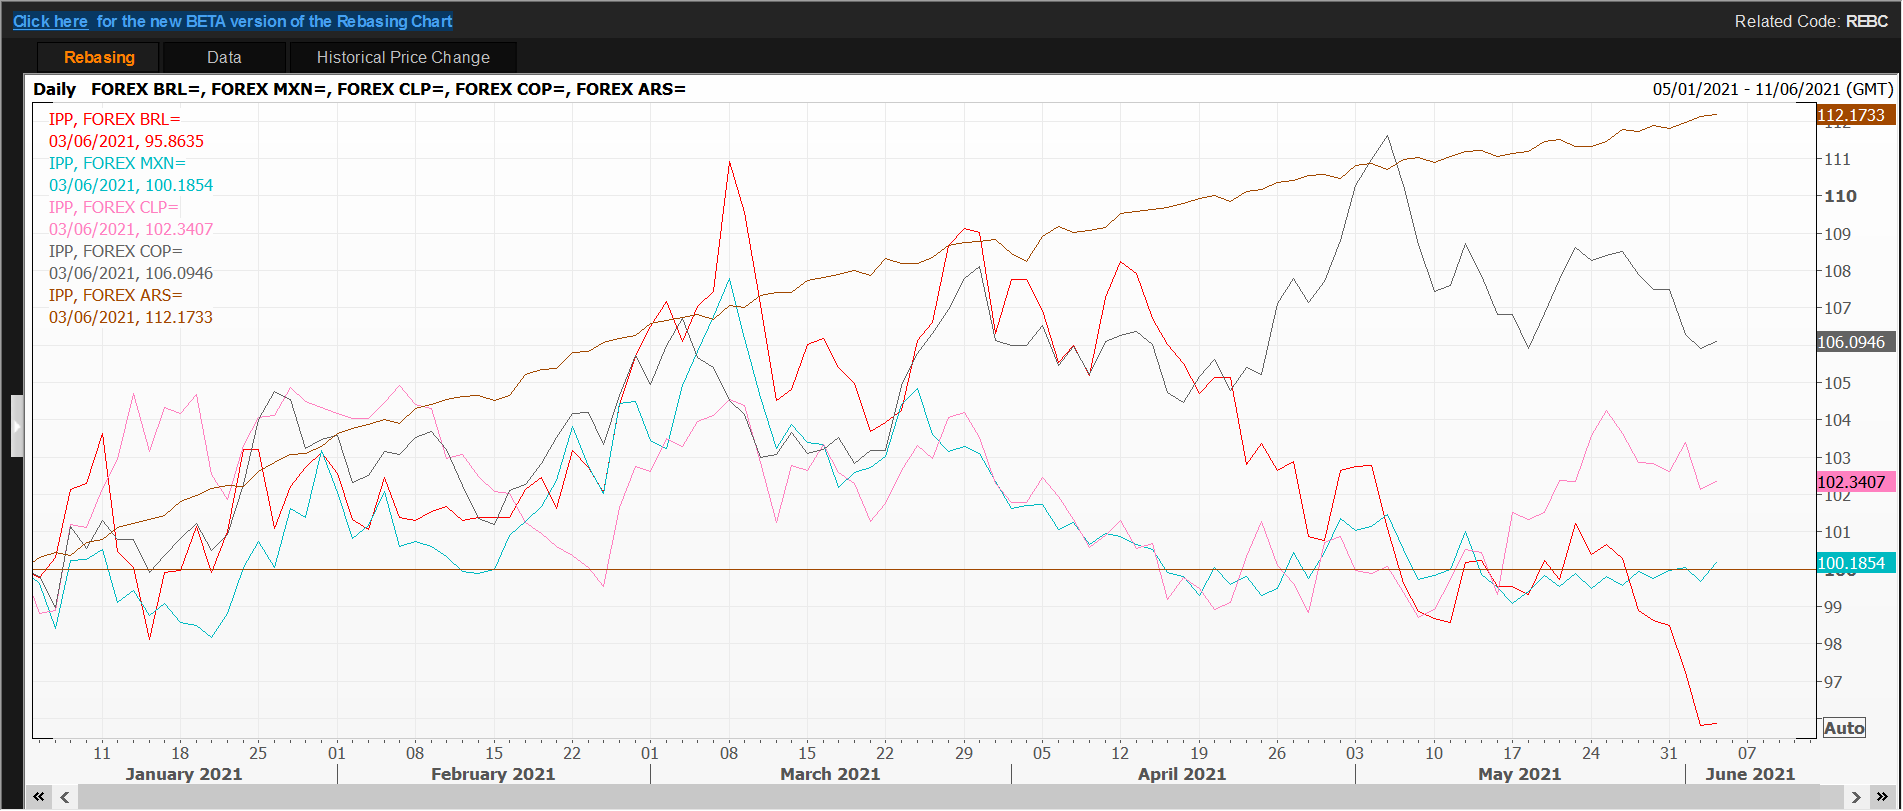 In the first chart are lumped the South American currencies I follow; needless to say the Venezuelan bolivar or the Cuban peso do not feature. The red line, the Brazilian real, weakened sharply (11%) in early March but subsequently regained its composure and is currently 4% stronger than where it kicked off. The brown line at the top is Argentina’s peso which has seen a steady devaluation of 12%. In fact, it’s way too steady – because this is the official exchange rate, not the one at which financial calculations are made. With retail price inflation (the official version) running at nearly 50% per annum, the real loss of purchasing power mid-year would take the chart up to 150%.
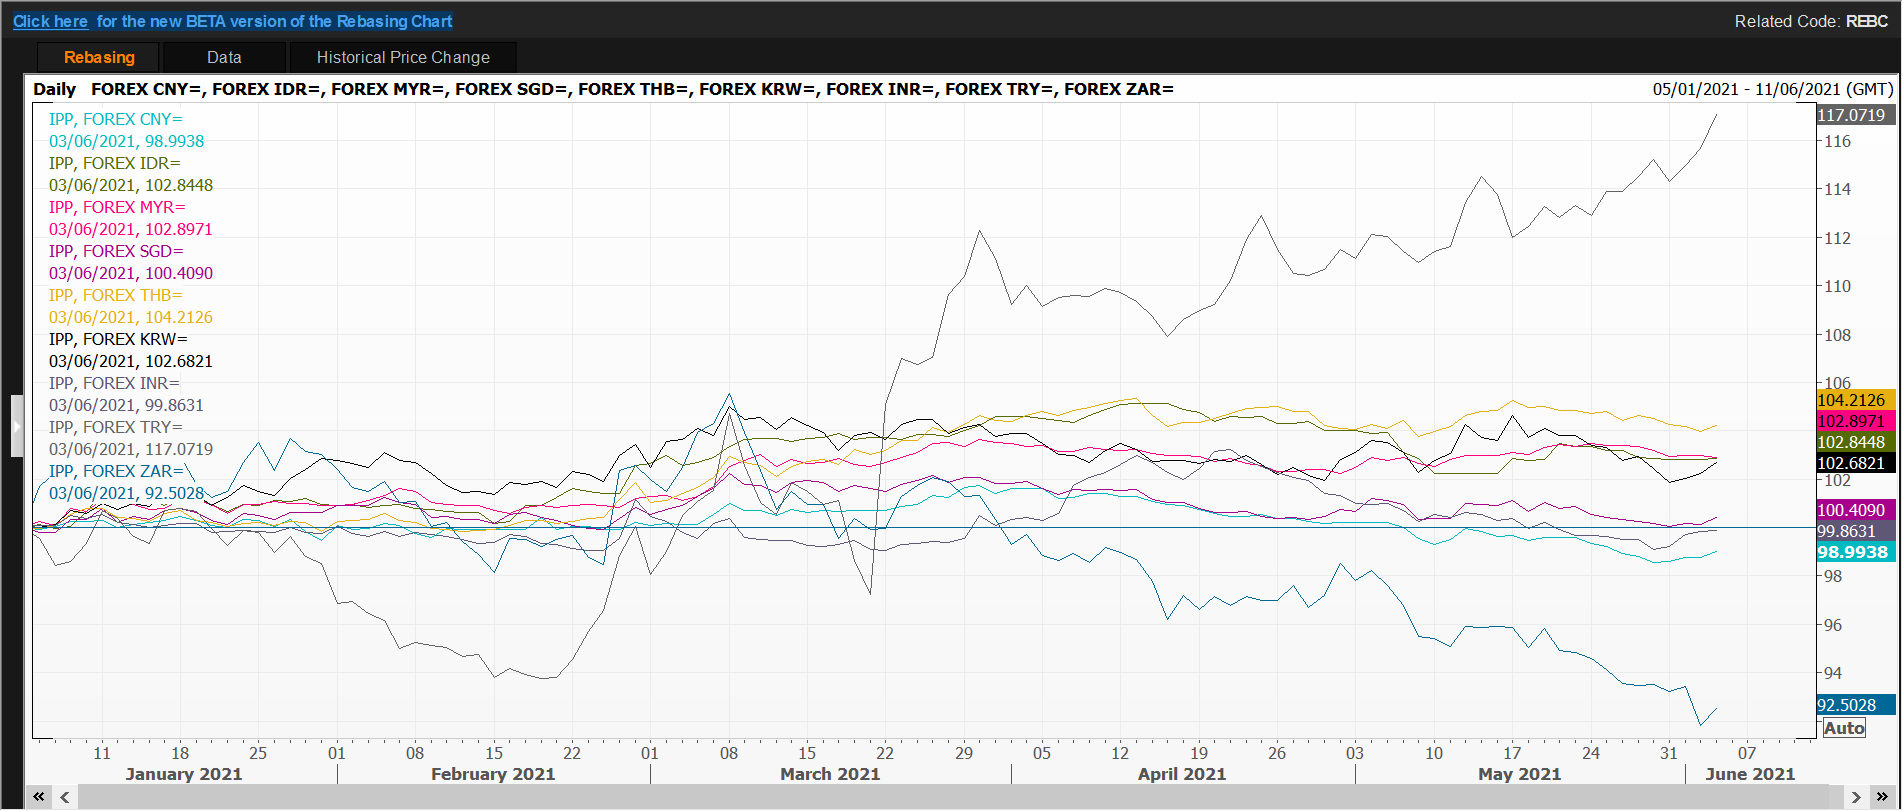 The second chart are Asian currencies – with the South African rand thrown in for good measure. The Turkish lira (grey line) has already lost 17% this year, a resumption of a 30-decade long trend – with or without ‘strong-man’ leaders. The dark blue line at the bottom is the Zuid Afrika rand (ZAR) which from its weakest ever at 19.3445 in March, is now 8% stronger against the greenback – despite their version of Covid-19.
You see, you never know what might happen.
Tags: Currency, inflation, relative value
The views and opinions expressed on the STA’s blog do not necessarily represent those of the Society of Technical Analysts (the “STA”), or of any officer, director or member of the STA. The STA makes no representations as to the accuracy, completeness, or reliability of any information on the blog or found by following any link on blog, and none of the STA, STA Administrative Services or any current or past executive board members are liable for any errors, omissions, or delays in this information or any losses, injuries, or damages arising from its display or use. None of the information on the STA’s blog constitutes investment advice.


Latest Comments