


Commodity Channel Index Not forgotten
Yesterday I was invited for an interview at a business television programme. As per the form of the last twenty years (when this terrified technical analyst first appeared on camera) I emailed over my charts beforehand, complete with trend lines, oscillators, and other features worth mentioning.
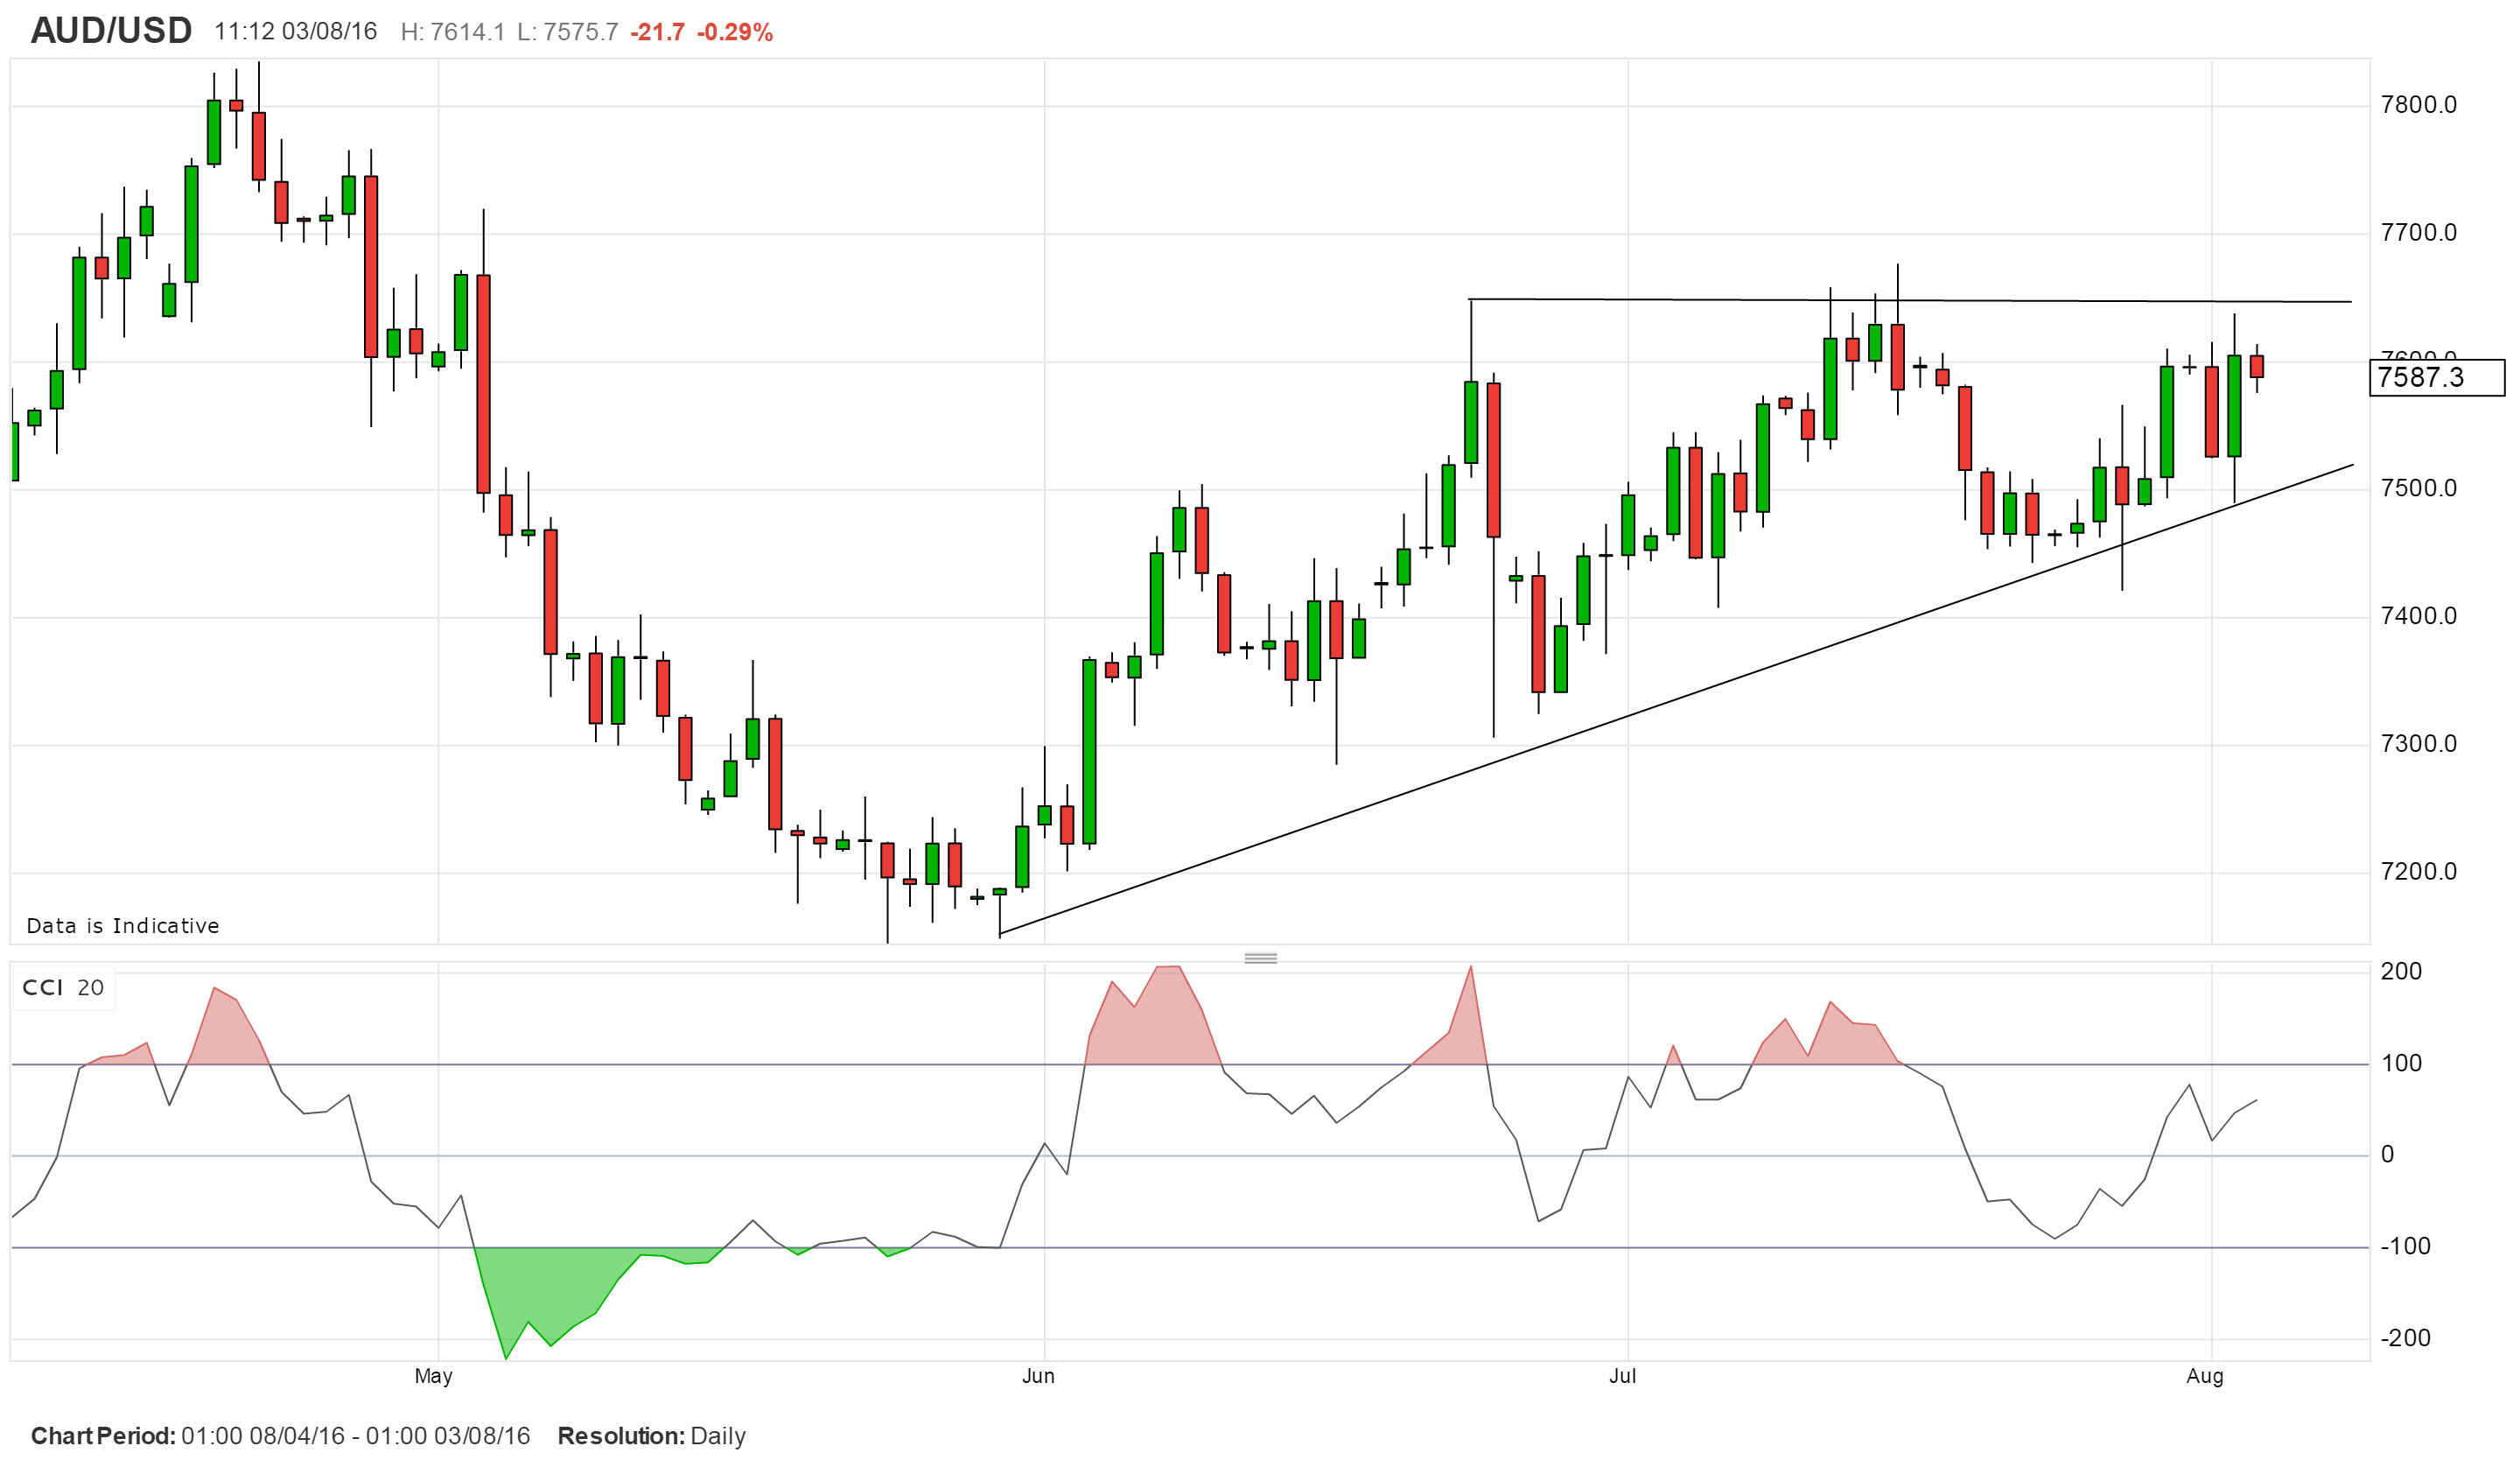
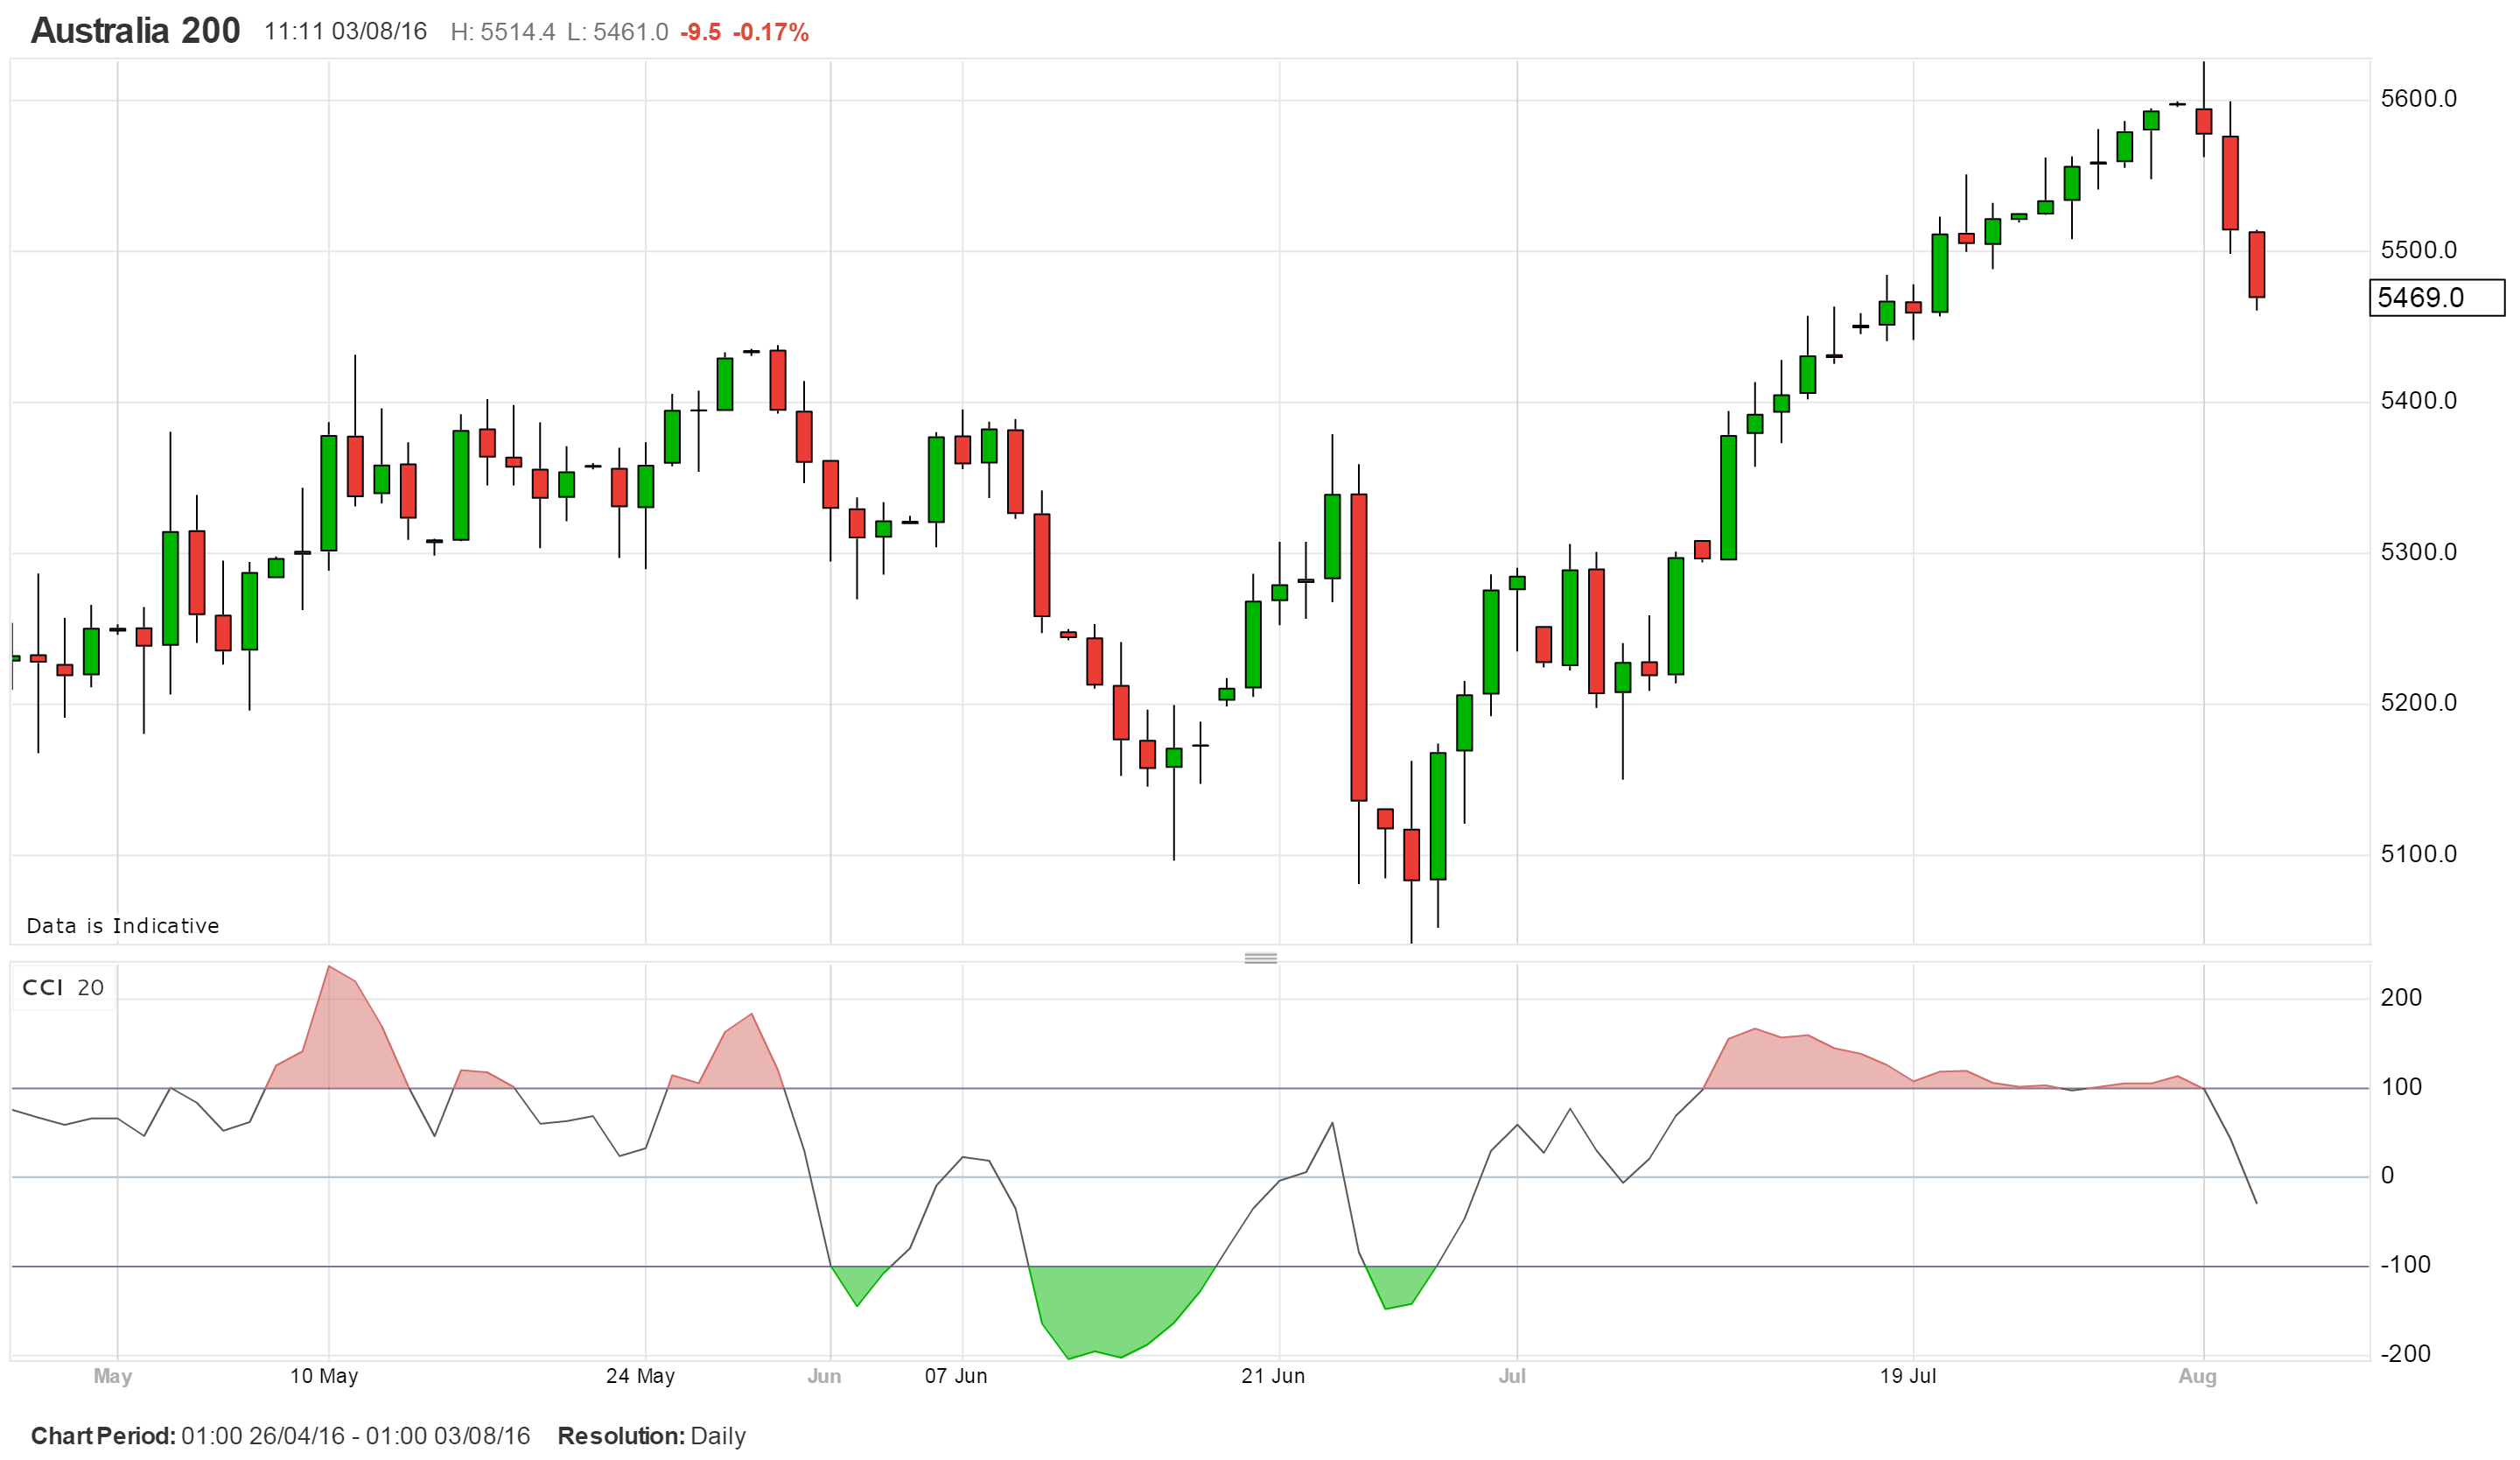
Because the Reserve Bank of Australia had cut their key interest rate to a new record low of 1.5 per cent that morning, I was asked to take a look all at things down under. As is so often the case with a well flagged move, markets did the opposite of what economic theory suggests; the Australian dollar remained steady against its US counterpart and the stock market sold off.
The chart of the latter, as used on the day, plotted the commodity channel index underneath daily candles. The presenter, with years of interviewing and production experience in financial markets behind her, was unaware of this indicator. I must admit I was surprised, but it set me thinking. Perhaps because the word ‘commodity’ is in its name, novices and outsiders assume it’s used only when analysing raw materials.
Or perhaps we have a surfeit of oscillators to play with and have deliberately whittled these down to only the most commonly used. A pity really as each has its merits. I find the CCI is one of the more sensitive, often turning faster than the RSI because it measures the difference between price and a simple moving average which is then divided by the mean absolute deviation. Most results will lie between minus 100 (oversold) and plus 100 (overbought). I wait until they get beyond these levels and then dip back inside the range for confirmation of a change in trend. As always, this is used in conjunction with other methods of technical analysis.
Its name may stem from the fact that it was first featured in ‘Commodities’ magazine in 1980, having been developed by Donald Lambert, rather than because he was trading commodities.
I could go on but why not take a look here: http://stockcharts.com/school/doku.php?id=chart_school:technical_indicators:commodity_channel_index_cci
Tags: Commodity Chanel Index, oscillators, overbought
The views and opinions expressed on the STA’s blog do not necessarily represent those of the Society of Technical Analysts (the “STA”), or of any officer, director or member of the STA. The STA makes no representations as to the accuracy, completeness, or reliability of any information on the blog or found by following any link on blog, and none of the STA, STA Administrative Services or any current or past executive board members are liable for any errors, omissions, or delays in this information or any losses, injuries, or damages arising from its display or use. None of the information on the STA’s blog constitutes investment advice.


Latest Comments