


Candles at night time: But wait and see what they look like first thing in the morning
In the 1960s my family lived in Rio de Janeiro which had sudden power cuts all too often; my sister and I regularly did our homework and then had dinner by candlelight. Homes, rich and in the poor favelas, had a bundle of cheap white candles and a box of matches at the ready. In the 1970s we moved to Europe where bored bourgeois housewives learnt how to make their own candles – usually multi-coloured fat ones; these were an everyday feature of our dining room table. In the 1980s my mother’s tablescapes became ever more elaborate, involving grand candlesticks and ever more candles as she said these showed off her silver and flattered her guests’ faces. All of the above involved trimming, cleaning, melting, re-making and reviewing candles, wicks, candlesticks and their wax-catching glass receptacles on a daily basis.
A bit like technical analysis really, for the many who favour the Japanese candles method of plotting price moves. Start by viewing charts daily looking for salient features and anomalies. Watch for bigger patterns to build and try to calculate the probability and extent of a potential price move. Above all, carefully see how any one candle morphs over time.
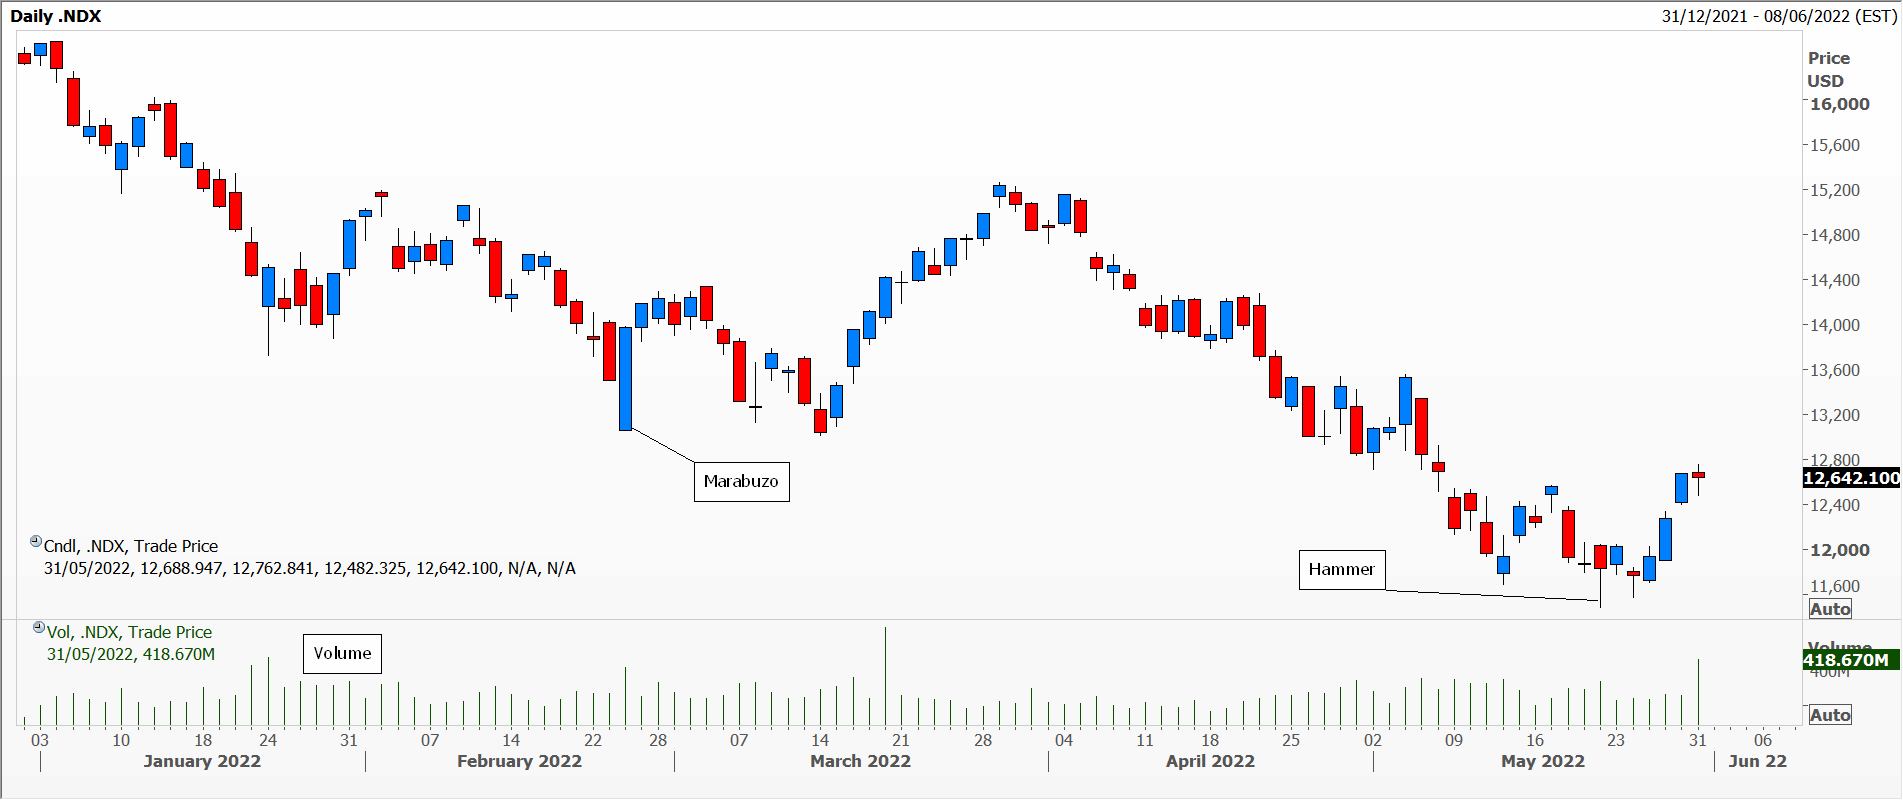
My example this week is the US Nasdaq Composite index which is currently in so-called bear market territory, an arbitrary cut off point of a 20 per cent decline from the most recent peak. Sweaty palms and investor jitters have not been reflected in the VIX index (at least as yet) because the move has been in one direction only – down since January’s record high. Daily candles are uninspiring, with just two named and worth watching.
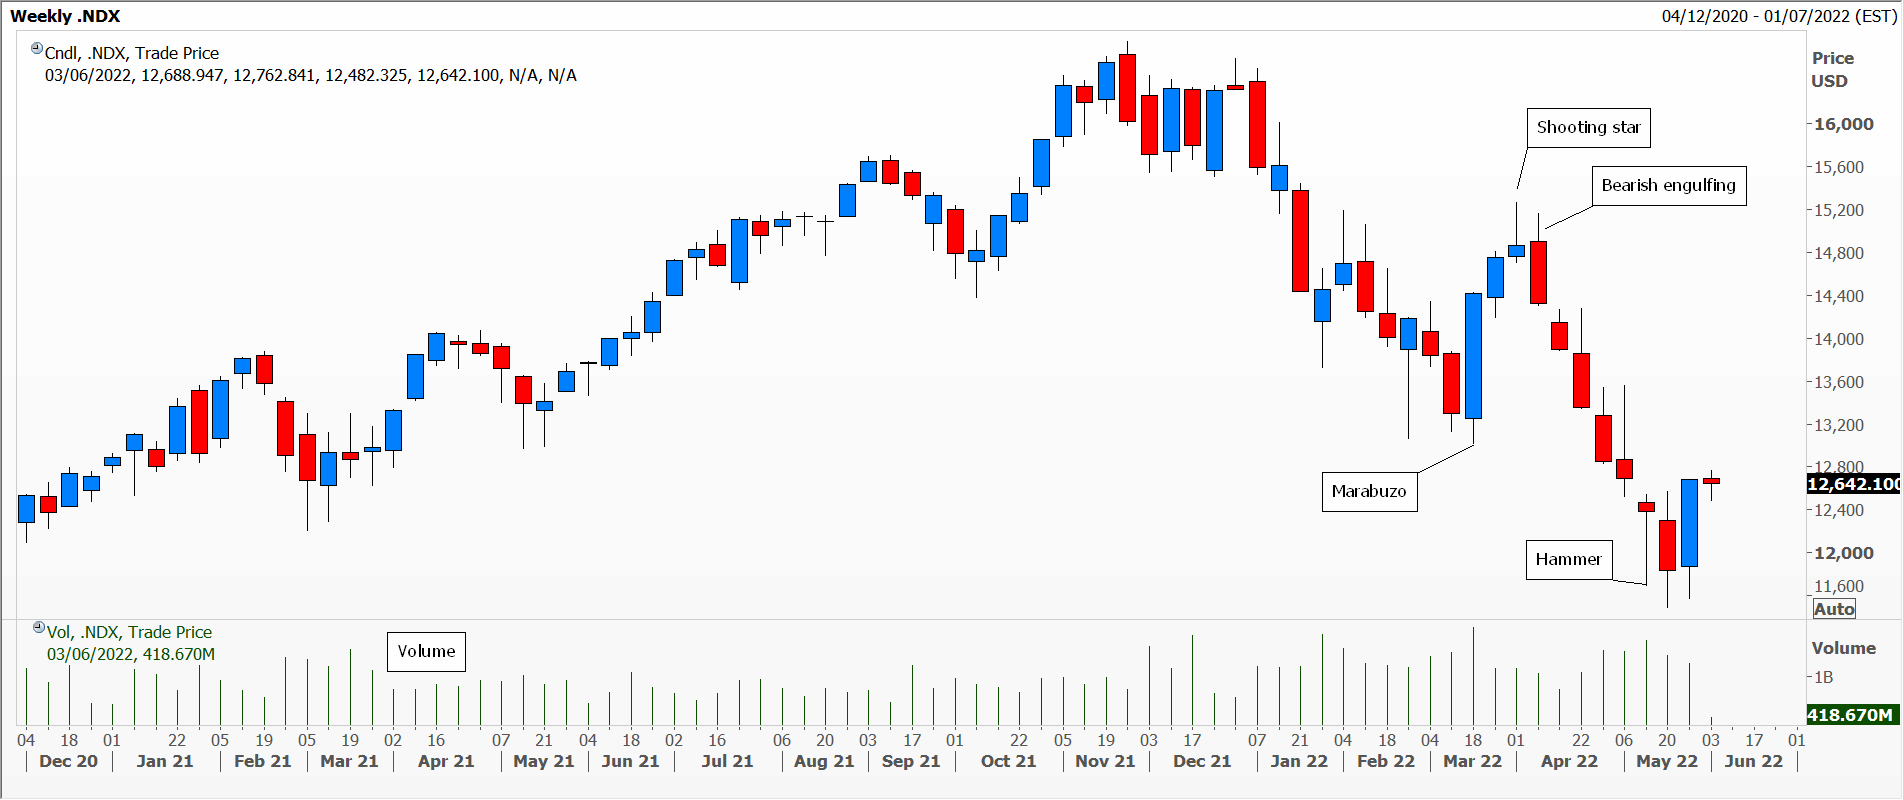
The weekly chart is a little more promising, where on the whole volume so far this year has been higher than usual. Note also the 7 consecutive weekly declines in April and May, just shy of the Rule of 8-10. Last week was almost a bullish engulfing candle, so probably time for a breather.
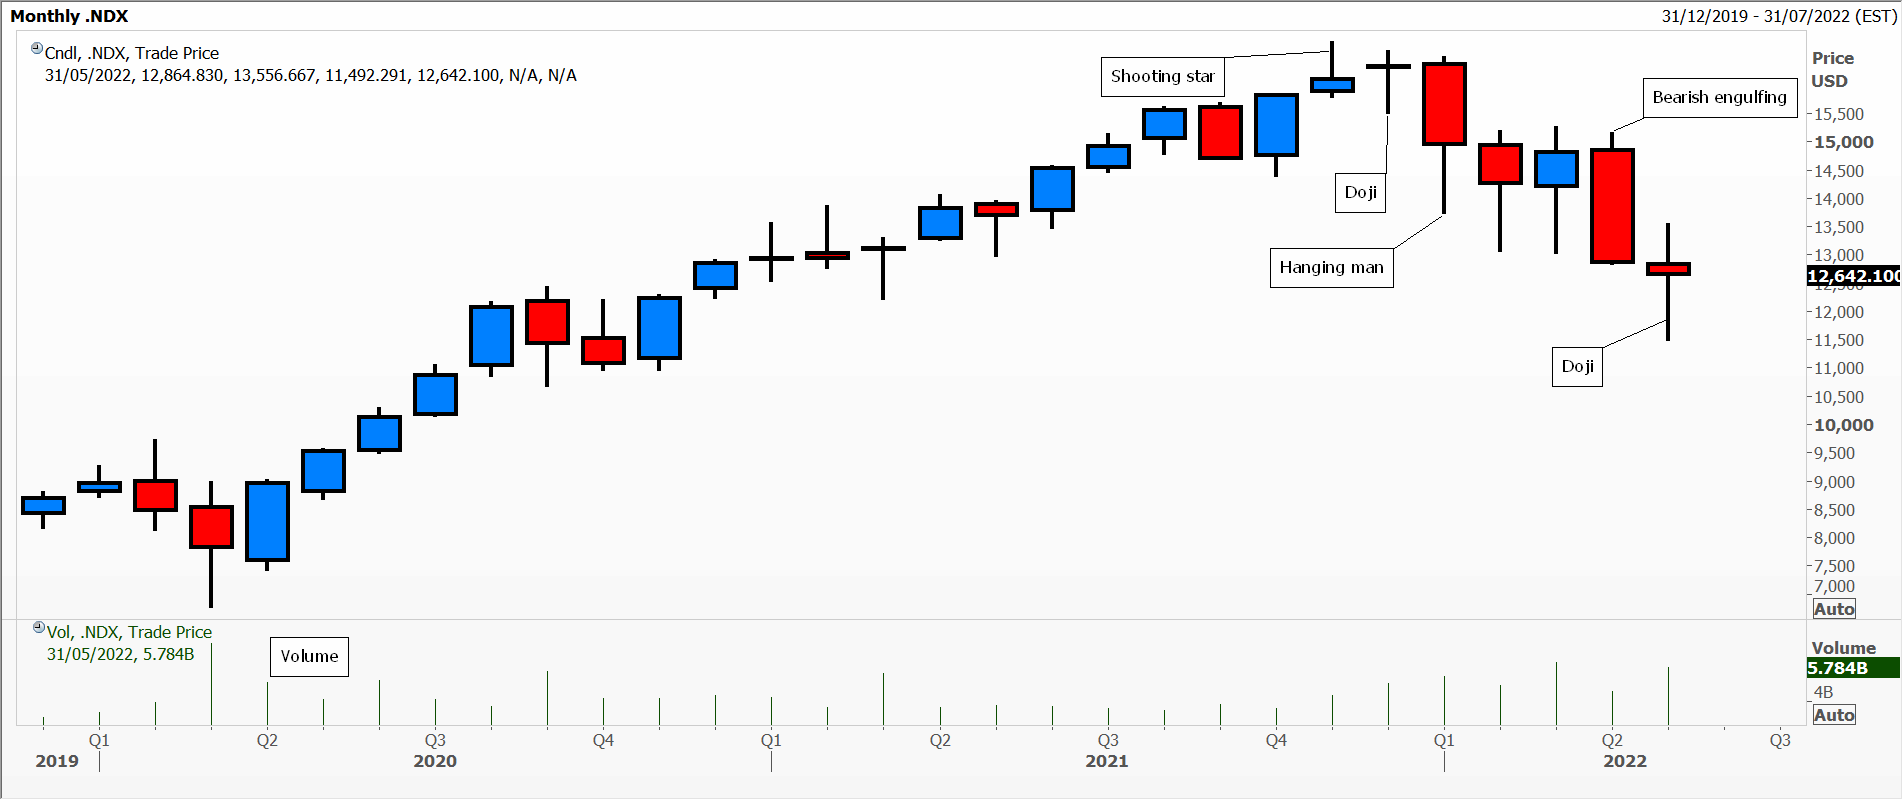
The monthly candles look a lot more punchy, with instability and a real tussle between buyers and sellers. Now I shall be waiting eagerly to see what the month of June has to offer and how quarterly and half-yearly candles will look like.
Nasdaq 1
Nasdaq 2
Nasdaq 3
Charts courtesy of MetaStock Xenith by Refinitiv
Tags: candles, patience, time
The views and opinions expressed on the STA’s blog do not necessarily represent those of the Society of Technical Analysts (the “STA”), or of any officer, director or member of the STA. The STA makes no representations as to the accuracy, completeness, or reliability of any information on the blog or found by following any link on blog, and none of the STA, STA Administrative Services or any current or past executive board members are liable for any errors, omissions, or delays in this information or any losses, injuries, or damages arising from its display or use. None of the information on the STA’s blog constitutes investment advice.


Latest Comments