


Bumping into Heikin Ashi: Pleased to meet you
At November’s STA monthly meeting we were treated to a very interesting talk by motivational coach Steve Ward (do watch the video which is now on the STA website). But there was an added extra in store for me over drinks and networking afterwards. Via Stephen Hoad, AKA The Stop Hunter, I was introduced to Heikin Ashi – not a person but a variation on candlestick charting. Bagging his business card I was determined to dig deeper.
Shortly afterwards he sent over a piece he wrote on the subject and, having got his permission, I thought I’d share the basics with other members. Like candles these ‘Average Bar’ candles as they are known have been used in Japan for a very long time. To build them one uses data from the most recent trading period plus that of the one before – an averaging process – where daily, weekly or intra-day data can be used. The chart looks similar but smoother, and that is its main advantage.
The averaging is done by manipulating the opening and closing prices. With this system the Heikin Ashi (HA) closing price is always the average of four data points: open, high, low and real close (O+H+L+C/4). The next period’s opening price is the mean of the open and closing levels of the latest HA candle. Likewise highs and lows are adjusted so that the high is the maximum of either the actual high point, the open or the close – all for the current period. Similarly the low will be the lowest of the real low, open or closing levels.
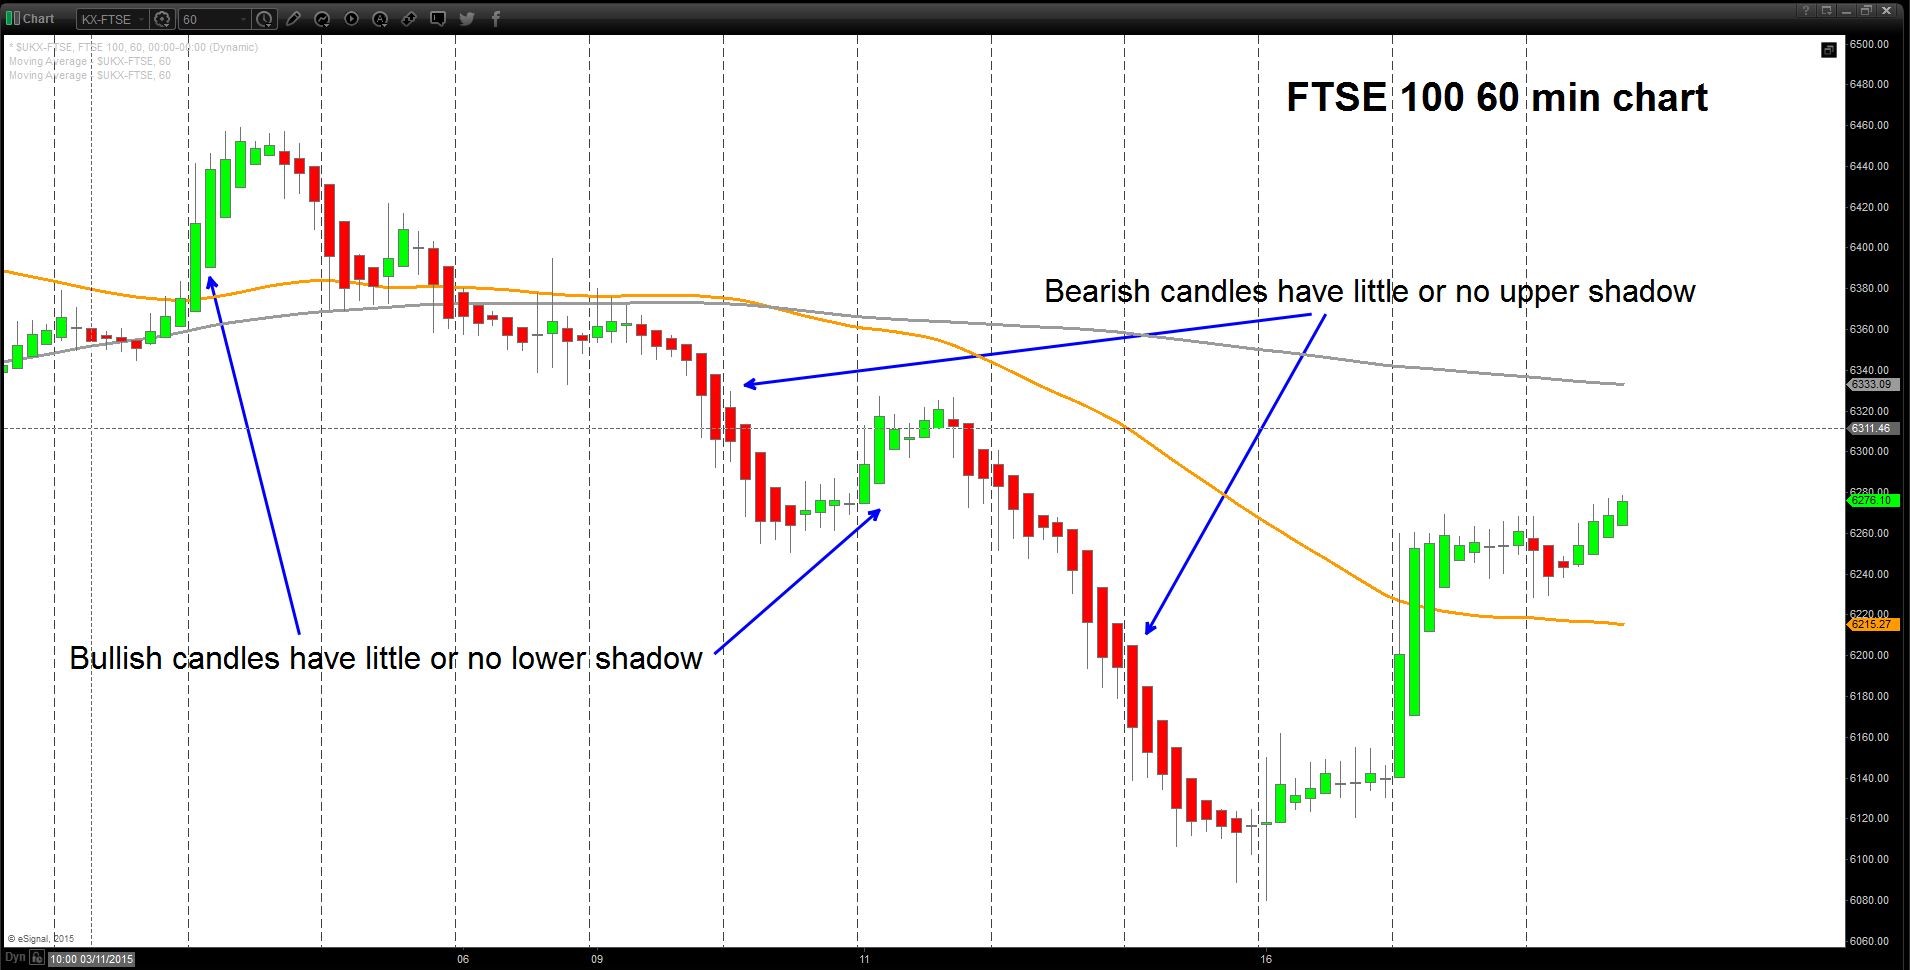
The most obvious effect is that many of the candles open or close at the extremes, candles with no wicks underlining the prevailing trend. When wicks are present, often spinning tops or doji candles, and candles start growing shadows, it’s more obvious that indecision has taken over and a turning point might be building. All the usual candles and chart patterns still apply where support and resistance levels are often clearer; there are never any gaps. Some might say that Heikin Ashi is to candles what point and figure is to bar charts – a smoothing mechanism which eliminates confusing noise.
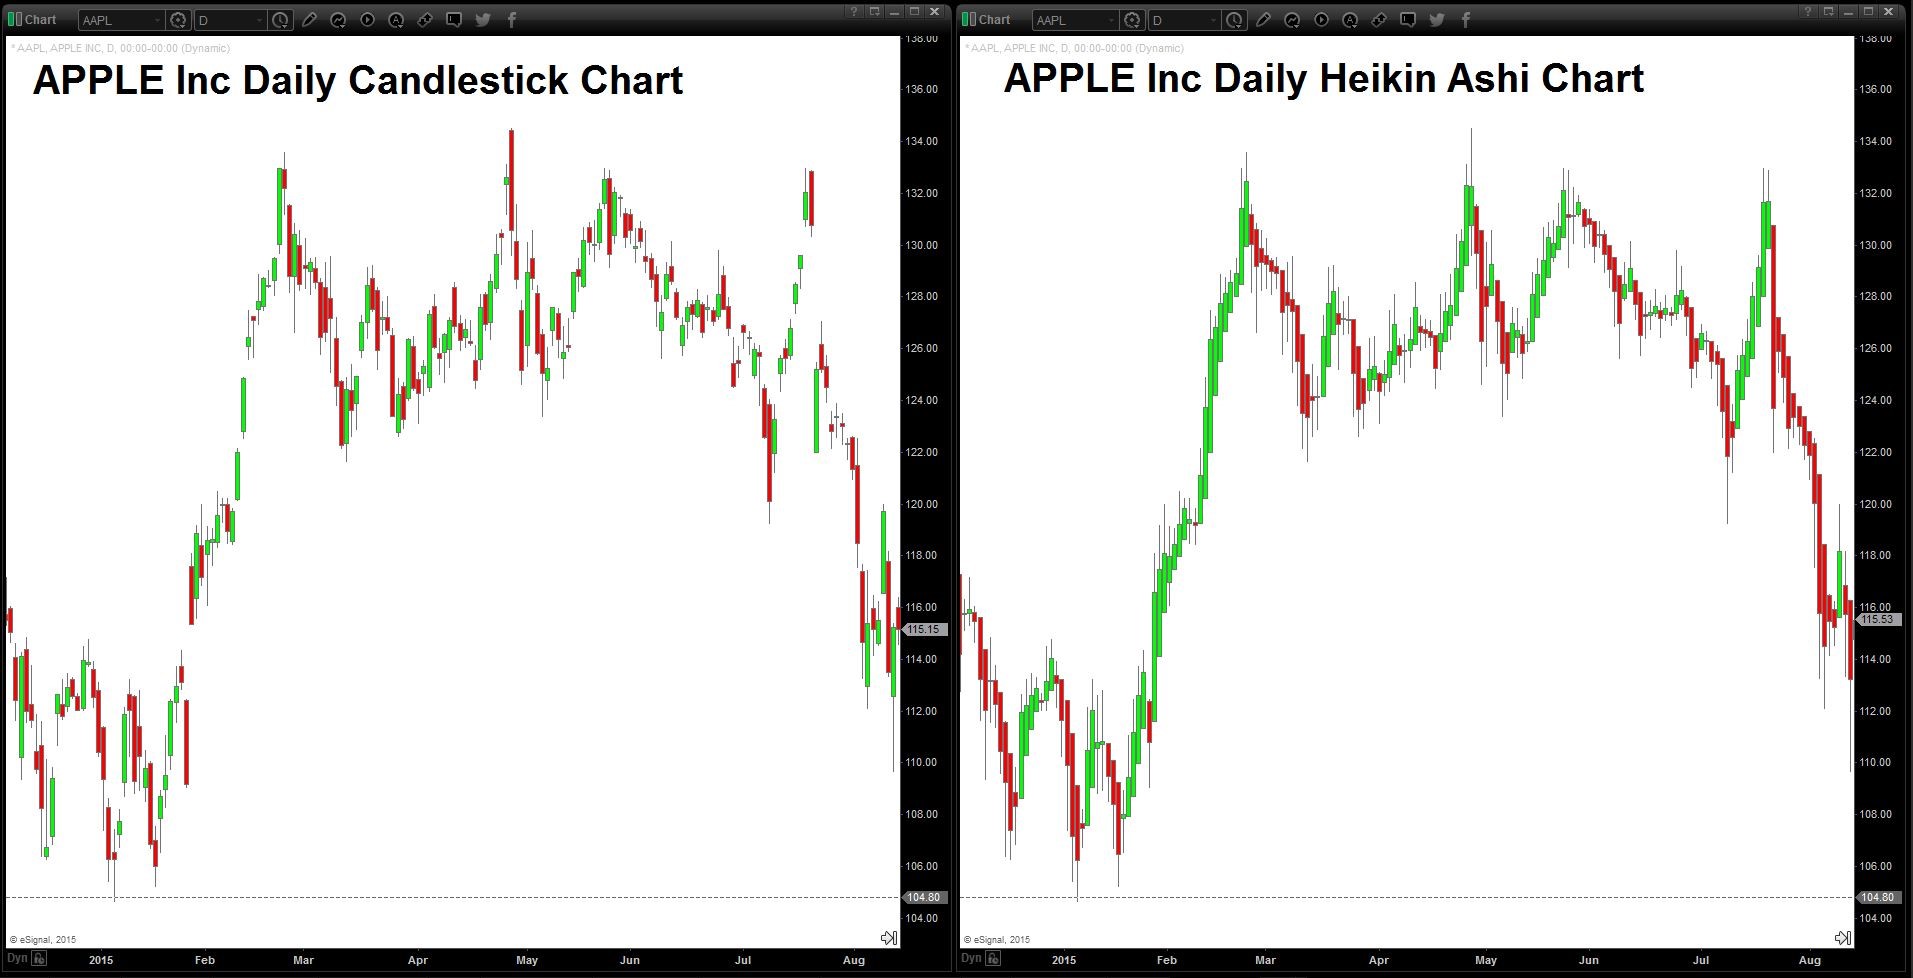
The charts below have been provided by E-Signal/Interactive Data but other vendors also can supply in this format. Take a good look at Apple’s share price which contrasts the two versions of the candles. As they say, a picture is worth a thousand words. For more information please see Stephen’s paper click here
Tags: averaging, candles, noise, volatility
The views and opinions expressed on the STA’s blog do not necessarily represent those of the Society of Technical Analysts (the “STA”), or of any officer, director or member of the STA. The STA makes no representations as to the accuracy, completeness, or reliability of any information on the blog or found by following any link on blog, and none of the STA, STA Administrative Services or any current or past executive board members are liable for any errors, omissions, or delays in this information or any losses, injuries, or damages arising from its display or use. None of the information on the STA’s blog constitutes investment advice.


Latest Comments