


Additional uses of the DMI indicator by Karen Jones Head of FICC Technical Analysis , Commerzbank
I have found the DMI indicator to be a useful tool. The more traditional way to use this index is in conjunction with an ADX signal above 20 (this tells you that a market is trending in the first place). You then buy if the +DI> -DI or sell if -DI>DI+. For a more extensive explanation of the DMI index please click here (description of DMI indicator).
However I have found additional ways to use this indicator. It can help to determine if a support or resistance level is likely to be breached. I watch the DMI index for CONFRMED buy and sell signals. These happen when the +DI or the –DI start to take out their previous peaks.
Here is an interesting example on the daily GBP/USD chart. The initial crossover of the +DI above the –DI happened on the 15th April 2015, however on the 16th April we saw the +DI (blue line) break above the previous peak on the –DI (the red peak). This gave us an early warning signal that there was an increased risk of a break above the 1.500 resistance. The break of this resistance was seen the next day and a close above this resistance level was seen on the 22nd April 2015. At this stage the ADX indicator was still below the 20.00 level – BUT it was rising.
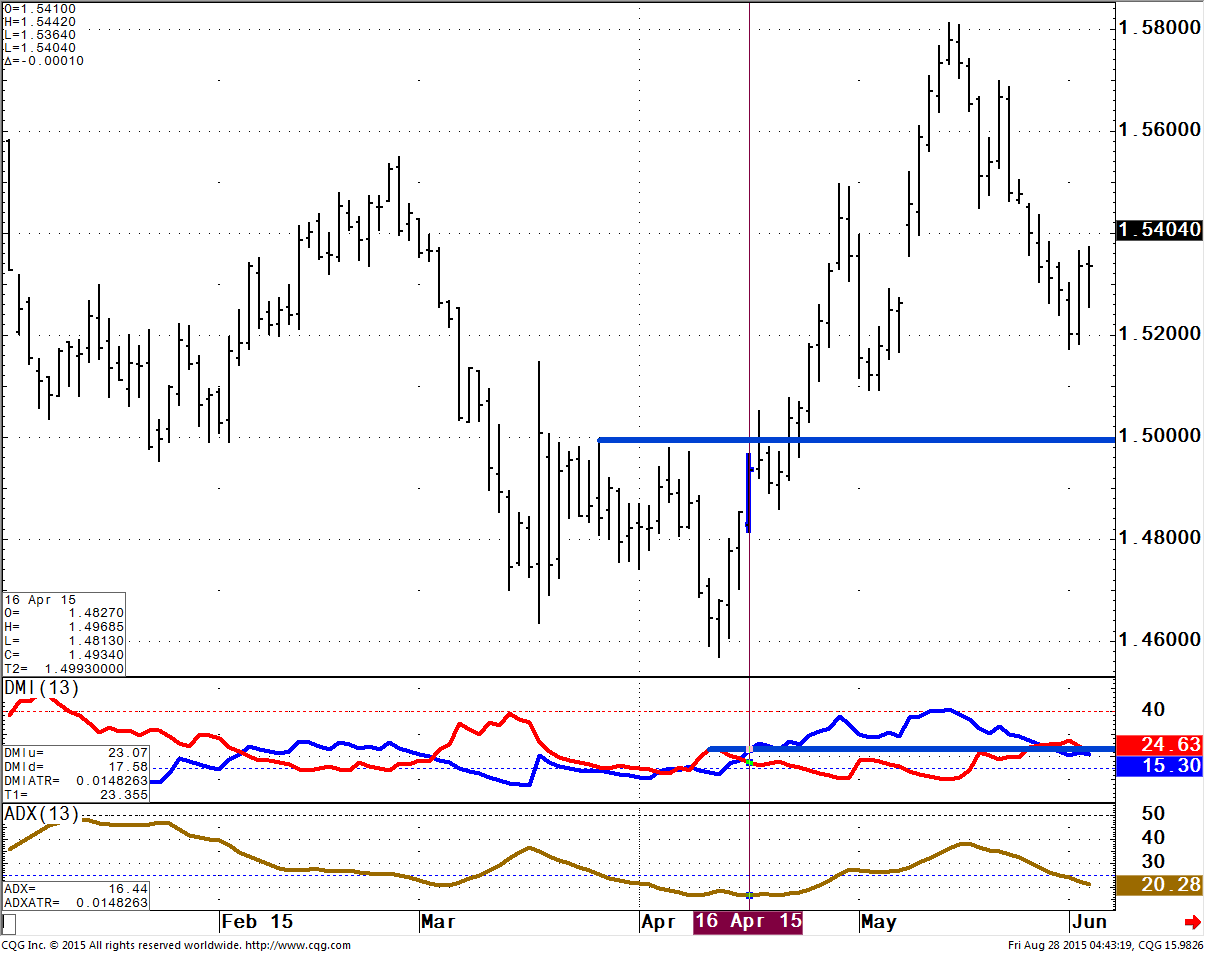
In this particular example the confirmed buy signal got you into the trade pretty early – the ADX indicator did not break above 20 until the 27th April. However once this was seen (a confirmed signal+ ADX>20) this does give you an opportunity to add to the trade.
The views and opinions expressed on the STA’s blog do not necessarily represent those of the Society of Technical Analysts (the “STA”), or of any officer, director or member of the STA. The STA makes no representations as to the accuracy, completeness, or reliability of any information on the blog or found by following any link on blog, and none of the STA, STA Administrative Services or any current or past executive board members are liable for any errors, omissions, or delays in this information or any losses, injuries, or damages arising from its display or use. None of the information on the STA’s blog constitutes investment advice.


Latest Comments