


Big bars and candles: How to interpret them
They’re easy to spot, but do we really know what they mean? October saw strong rallies in many equity indices and it got me thinking. First reactions are shock and awe, glee too, but digging a little deeper are the moves really bullish and are they game-changers?
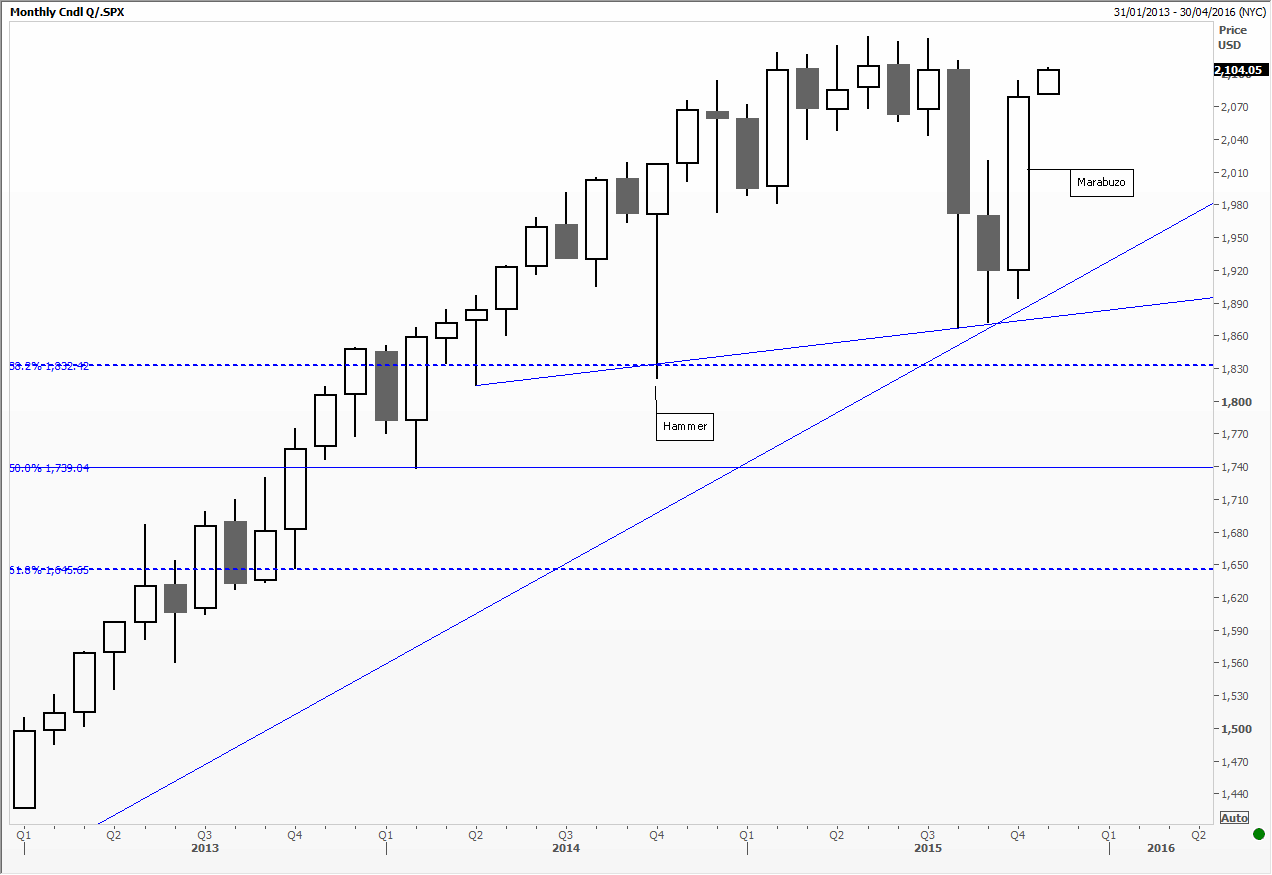
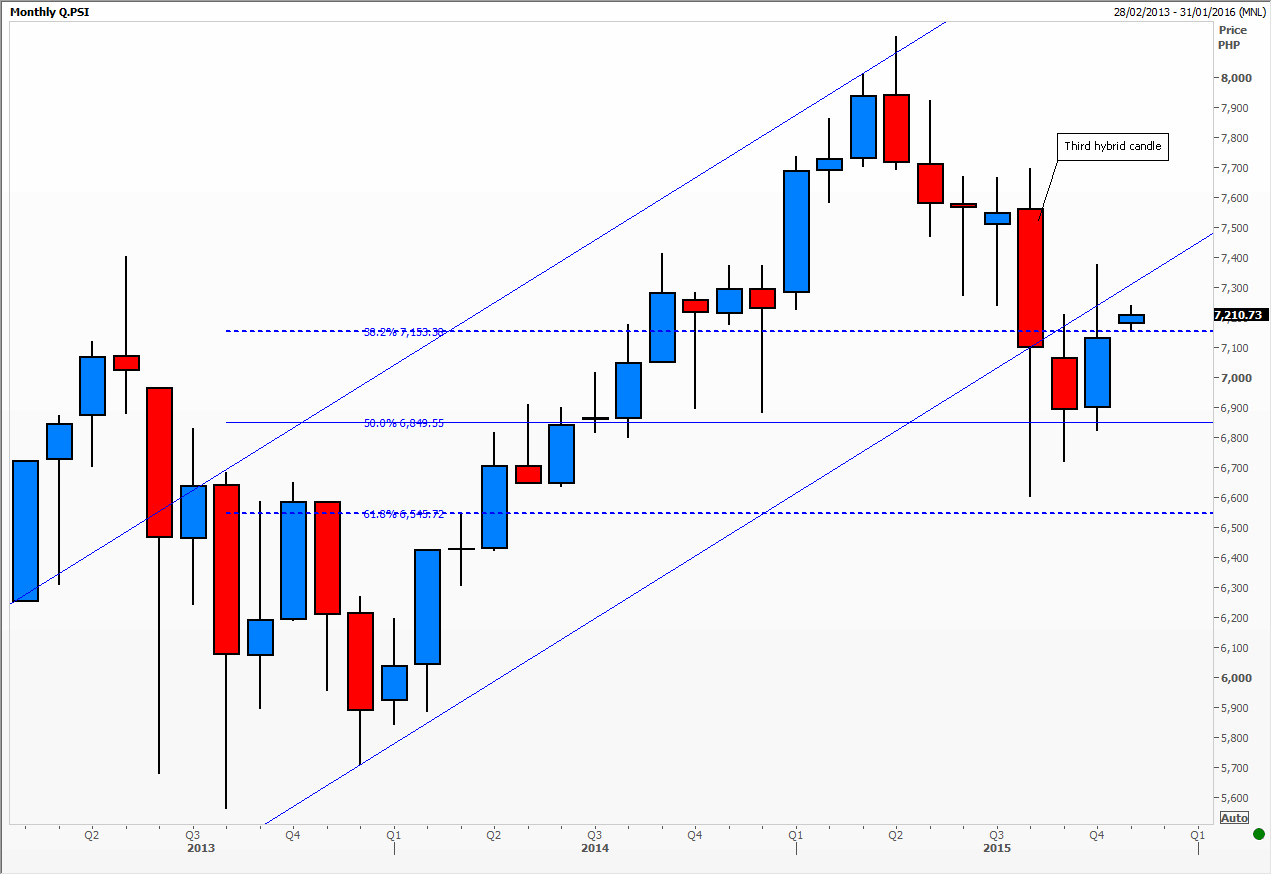
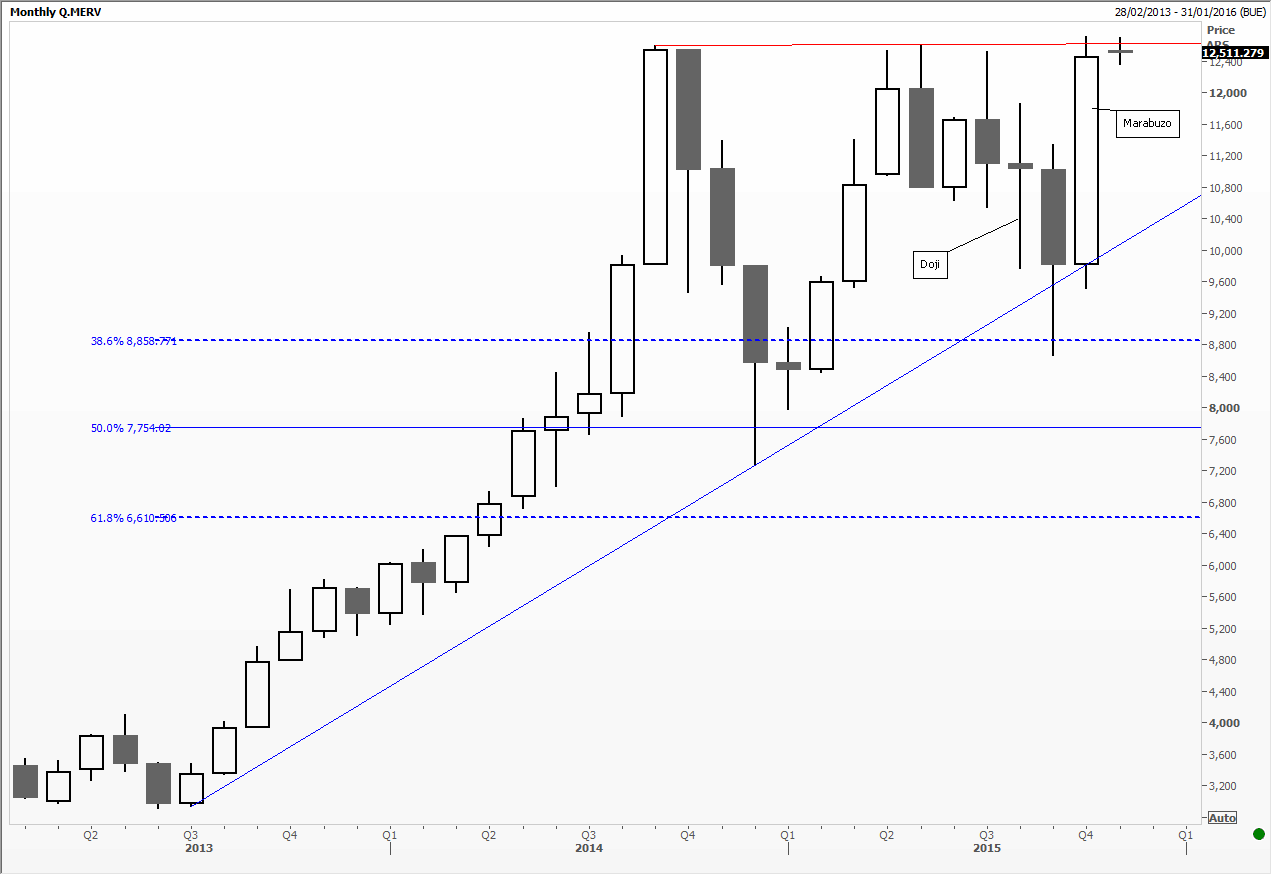
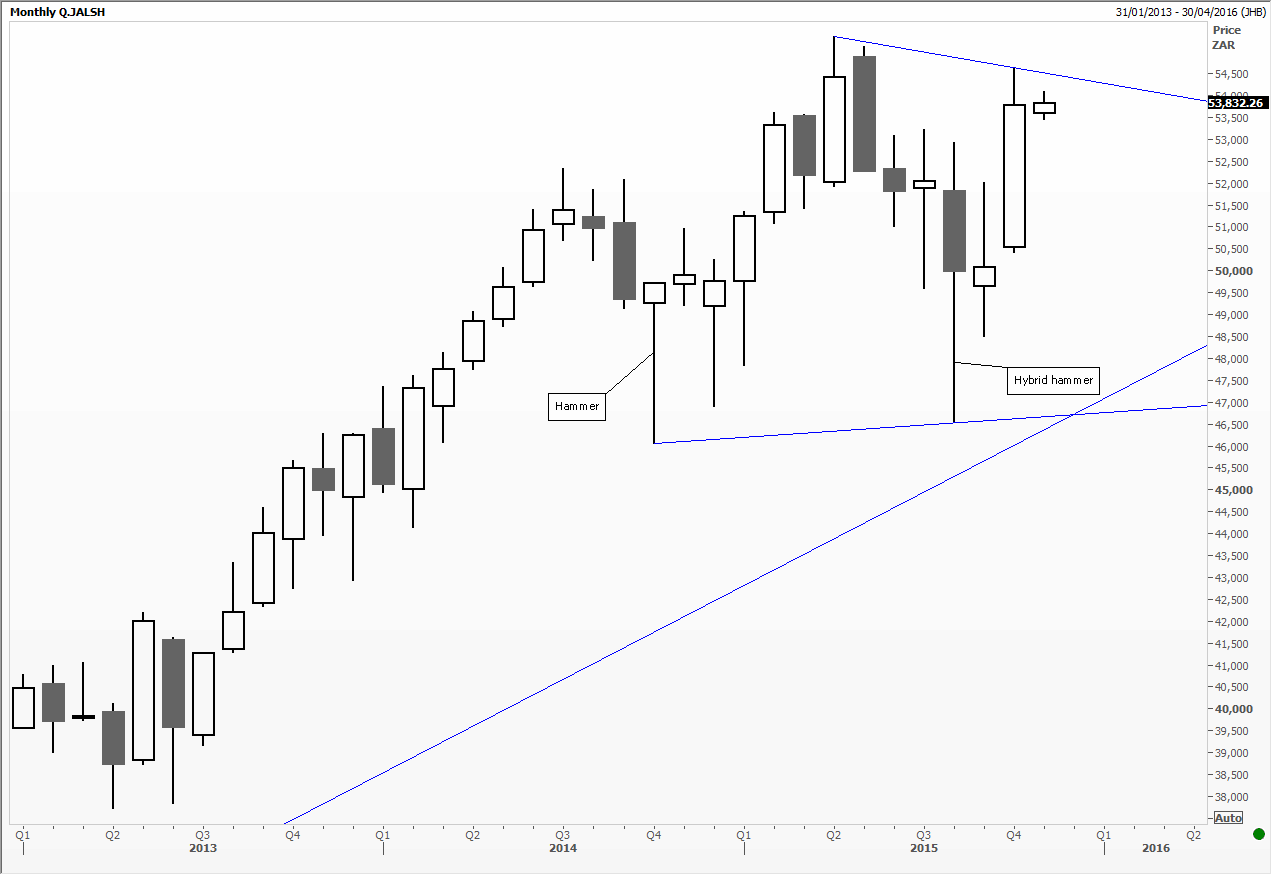
The Japanese have special names for big candles, Marabuzo being one where the market opens at one extreme and closes at the other, creating a big ‘body’. It means that the market moved pretty much all day (or week, month, etc.) in one direction only and it’s probably part of a continuing trend. Candles with big wicks and a relatively small bodies at one end – if towards the end of an established trend – are called shooting stars and hammers and signal reversals, where the original thrust has been reversed by the more determined hand. Big wicks with almost non-existent bodies at their centre are dojis and are a warning that things might start to change, buyers and sellers in an uneasy limbo. So big candles, and by extension bars, ought to be interpreted differently. As always, if accompanied by higher than normal volume their significance is enhanced.
But what about markets that gap, and then just carry on? If this coincides with a break through an important chart level this is likely to signal the start of a trend or the next phase in a larger trend. Gaps on the way up followed by big candles are usually associated with aggressive new positioning which may well be reinforced by positive news, feeding on itself. However gaps on the way down, followed by large drops in each time period, usually signal a lack of bids. Suddenly there is a buyers’ strike so volume is low relative to the size of moves, and those who need to sell become increasingly desperate, often to a chorus calling ‘get me out!’
For a more detailed look at intra-day volume on big days we would recommend Market Profile which gives a good idea as to where exactly transactions took place. Clustering at the top and bottom of the day’s range one can assume that suddenly bids or offers were withdrawn. To capture this idea on point and figure charts Jeremy du Plessis is now linking boxes with vertical lines denoting a sudden rush, or even a gap, from one level to the next.
Tags: candles, Market Profile, Point & Figure, volume
The views and opinions expressed on the STA’s blog do not necessarily represent those of the Society of Technical Analysts (the “STA”), or of any officer, director or member of the STA. The STA makes no representations as to the accuracy, completeness, or reliability of any information on the blog or found by following any link on blog, and none of the STA, STA Administrative Services or any current or past executive board members are liable for any errors, omissions, or delays in this information or any losses, injuries, or damages arising from its display or use. None of the information on the STA’s blog constitutes investment advice.


Latest Comments