


Being mean with a pitchfork: And blowing out Bollinger
Recent speakers at STA monthly meetings have given a couple of interesting talks on the Andrews pitchfork and its modified version, written up in this blog earlier. I have certainly used the analysis for many years and find it useful, especially as a guide to the sort of magnitude of moves one can expect, and the retracements, often in stages, that one must deal with while remaining inside a trend.
Now look at my first chart and see if you can say for certain that I have drawn my pitchfork correctly. (The chart is a monthly one of US dollars per pound starting when some exchange rates began to float in 1972). The lines certainly capture most of the price action, in a depressing and relentless move to sterling weakness. The central tine is, in fact, the mean regression over the history of the decline and fall. After 2017’s rally, prices were capped this year by the mean. The outer lines are therefore, standard deviations around this, in this case 1 standard deviation. As an aside, one that I’m increasingly using is a 1.6 standard deviation – about half way between 1 and 2, and a Fibonacci number).

Chart 1
The difference is that unlike the pitchfork which is static, the mean changes as new data is used for the calculation. The second chart shows the weekly candles of the moves since late 2016, again 1 standard deviation containing nearly all price action.
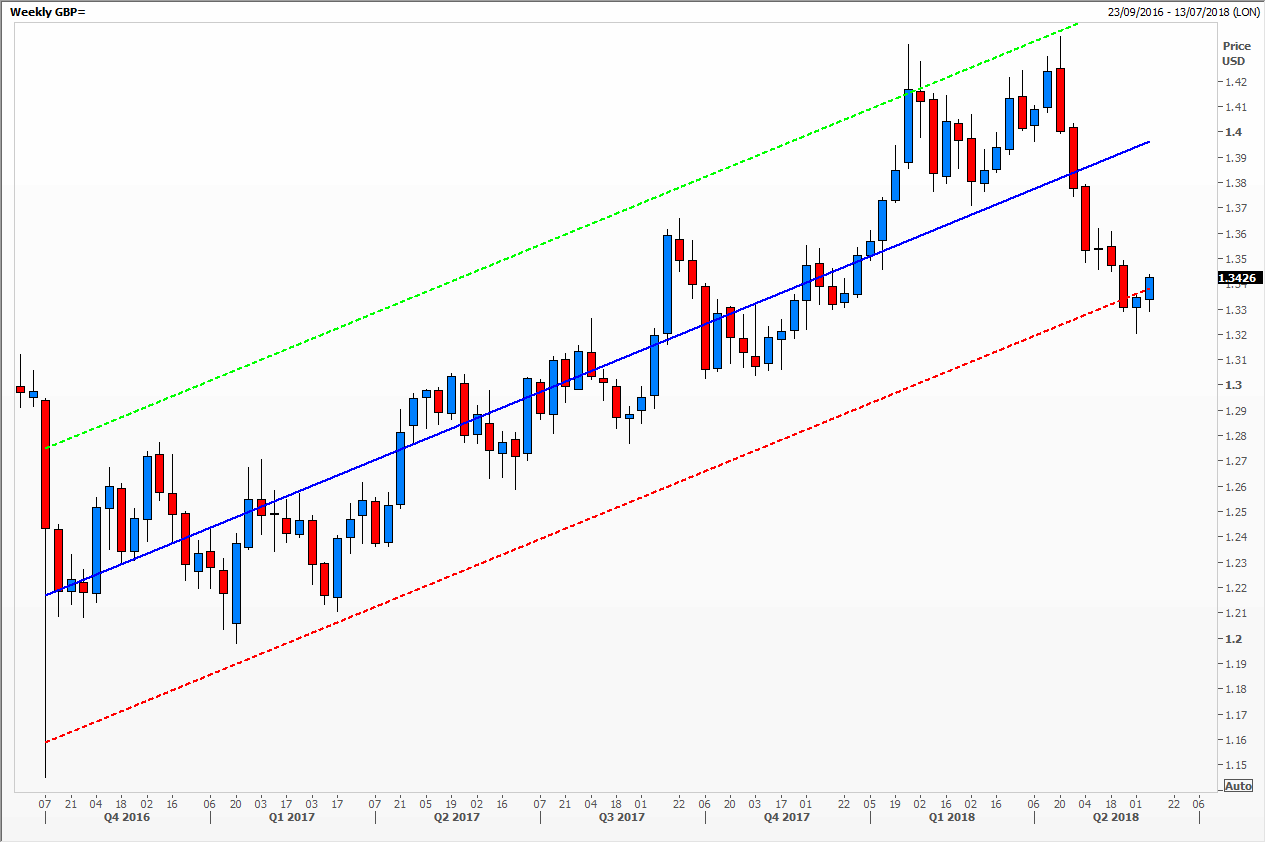
Chart 2
The third chart shows how the rake of the trend steepened in August 2017, reflected in the mean regression line.
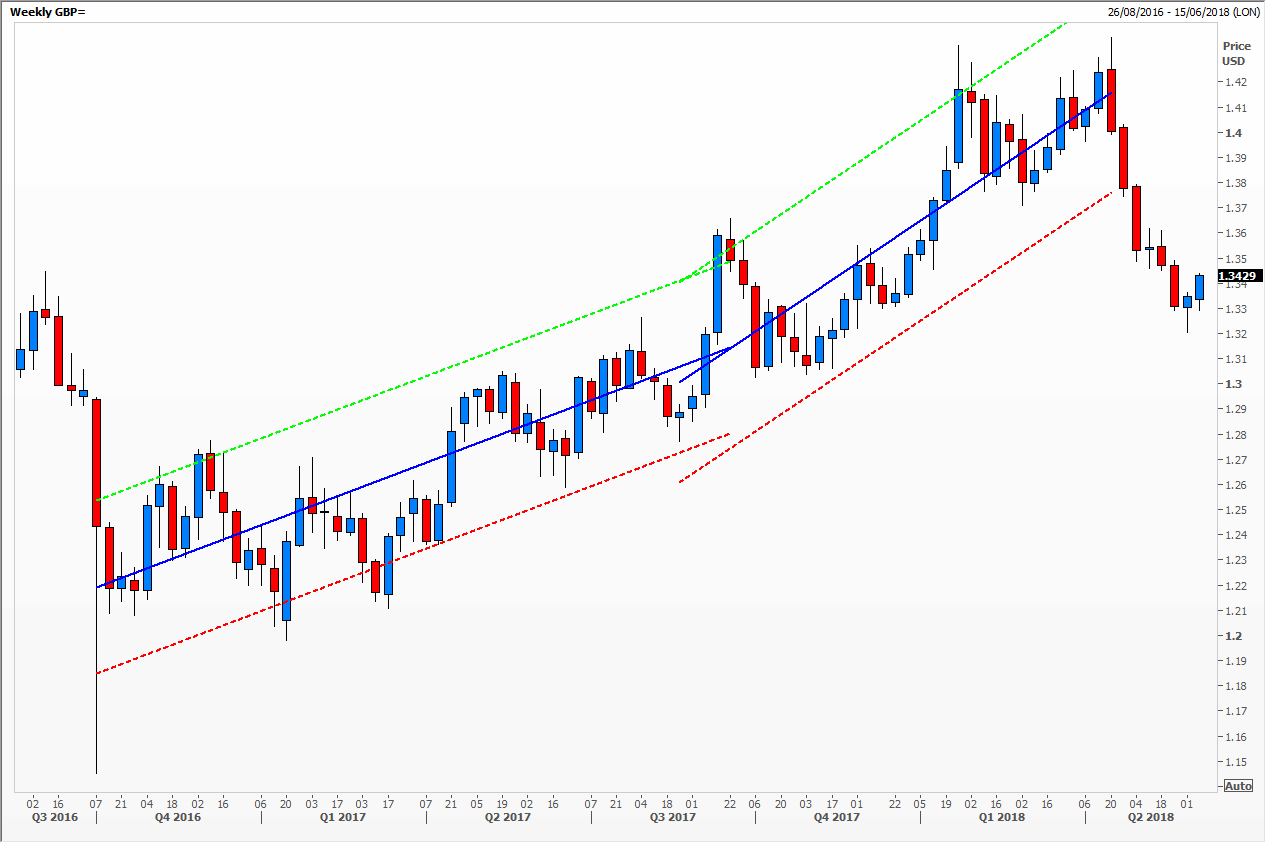
Chart 3
Another study which has some similarities, with a central line and upper and lower lines plotted around it, are Bollinger Bands. These too are dynamic, narrowing as daily ranges narrow, bursting apart when prices push outside the recent band. What I think might be improved on is the fact that the widening of the outer band is symmetrical, perhaps not giving enough weight to the direction of the breakout. One way or another, the fourth chart, a weekly one of cable with a conventional 20 period and 2 standard deviations around it, has worked exceptionally well over what has been a torrid time for cable.
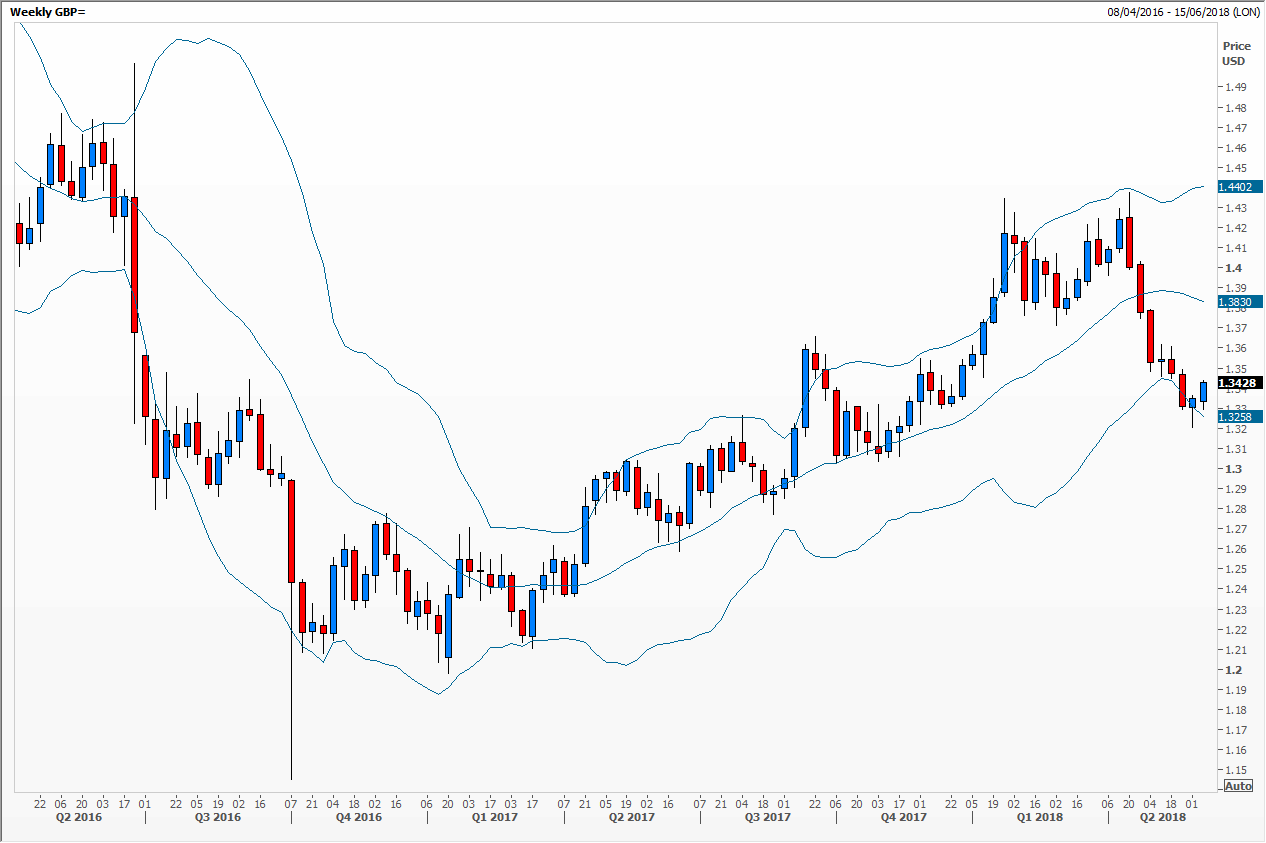
Chart 4
The views and opinions expressed on the STA’s blog do not necessarily represent those of the Society of Technical Analysts (the “STA”), or of any officer, director or member of the STA. The STA makes no representations as to the accuracy, completeness, or reliability of any information on the blog or found by following any link on blog, and none of the STA, STA Administrative Services or any current or past executive board members are liable for any errors, omissions, or delays in this information or any losses, injuries, or damages arising from its display or use. None of the information on the STA’s blog constitutes investment advice.


Latest Comments