


Media hones headlines: Because they sell
In a week where the Shanghai Composite Index lost 10 per cent of face value in just two days, cries of ‘tears’, and ‘I told you so’ abound. There is also an element of schadenfreude as these same writers didn’t spot the huge rally of the last four months, so busy were they making up interesting things to say about indices which were going nowhere.
It is also worth noting that markets which rally are generally seen as ‘a good thing’ while losses are catastrophic and a big deal. Once again, bias between bulls and bears.
Stockbrokers have a useful rule of thumb which states that a 10 per cent drop is a correction but a 20 per cent one is a bear market. Yes, but it depends on the market, doesn’t it. Penny shares regularly double and halve in value in a matter of days – because when one starts at close to nothing it’s easy to make a turn. Likewise economies which are on their knees and it doesn’t take much to see so-called ‘strong growth’.
In established markets, how much of a drop should set us fretting? A one-day change of 2 per cent of face value, I would suggest, is cause for concern; possibly a change in trend, but not necessarily so. A one week change in value, either up or down, of 5 per cent deserves close scrutiny. A one month move in price of close to 10 per cent rates a red flag. A 20 per cent loss over any time frame and I’m not really keen on that market any more – and probably will not be for a long time.
And this is where so many investors go wrong. Having failed to heed the warning signs, too complacent (or stingy) to adjust portfolios, they sit on things for too long. Along the way they tell themselves soothing stories of recovery plans, speculators overreacting, above all, that they know best and others will come round to their way of thinking.
Percentage moves described above are, of course, a rule of thumb. Not embedded in technical analysis but the sort of metrics that are best kept at the back of one’s mind.
As for Shanghai, a weekly and monthly shooting star candle which has not broken trend line support or the Ichimoku cloud and moving averages. So the jury is still out.
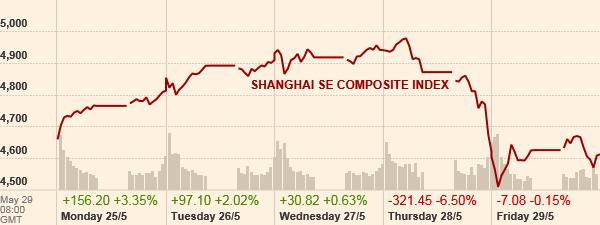
Chart courtesy of FT.
Tags: Bear Market, China, Equities, Indices, Stock market
The views and opinions expressed on the STA’s blog do not necessarily represent those of the Society of Technical Analysts (the “STA”), or of any officer, director or member of the STA. The STA makes no representations as to the accuracy, completeness, or reliability of any information on the blog or found by following any link on blog, and none of the STA, STA Administrative Services or any current or past executive board members are liable for any errors, omissions, or delays in this information or any losses, injuries, or damages arising from its display or use. None of the information on the STA’s blog constitutes investment advice.


Latest Comments