The element of surprise: Can technical analysis help?
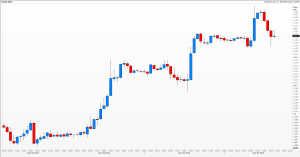
This week the euro rallied five US cents in 65 hours, despite on-going Greek drama, and all too many financial analysts were stumped, slaughtered, and lost for words. I have been wondering whether technical analysis can help in predicting surprise, or should we all just throw up our hands and, as consensus economists do, say it was unexpected and an outlier?

‘The dollar rally will regain momentum from next month, a Reuters poll of foreign exchange strategists showed on Wednesday, although its strength will depend on economic data and the timing of a Federal Reserve interest rate hike’ 41 of 55 analysts polled by Reuters this week believed, thinking the dollar was ‘just pausing for breath and that it will rally again soon’. “The onus on economic data to surprise sharply to the upside over the next few weeks is fairly high, else the Fed may be unable to prepare the market at the June FOMC for hikes commencing in Q3,” analysts at Barclays wrote in a note.
In the latest poll (published 3rd June), forecasters have moderately upgraded their expectations of the euro, although they expect the common-currency to trade lower in the coming twelve months. The euro is expected to fall to $1.05 in six months and further to $1.04 in a year. But the number of analysts who forecast the euro to trade at or below parity against the dollar has fallen — from 22 in April, 19 in May to 15 in the current poll.

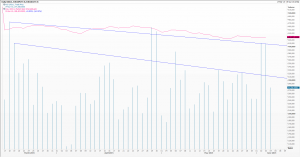
Now you know what they’re thinking, what can we do? Traditional volume and open interest charts can help, as always, with decreasing volumes and declining open interest suggesting complacency and lack of interest, as has been the case this year. Ta-rah! Hence the surprise.
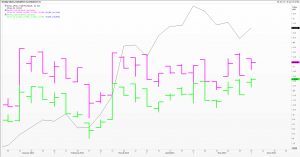
The put/call ratio should be monitored when available, the chart here showing this year’s continued preference (known as skew) for EUR/USD puts over calls (10 delta, one-month, at-the-money charted here). Also note the difference between the observed volatility, also known as historical volatility (the black line on our graph) against the implied volatility used for options prices. The bigger the difference, the greater the perceived need for insurance via options; and the more likely the surprise when it all goes pear-shaped.

Back to polling: it may not be so good at UK elections because of ‘the silent Tory’, but it is one of the best gauges we have of how people are thinking.
Please see our charts and go to
http://twitter.com/ReutersPolls
for other opinion polls you might be interested in.
Tags: countertrend, FX, open interest, polling, volatility, volume
The views and opinions expressed on the STA’s blog do not necessarily represent those of the Society of Technical Analysts (the “STA”), or of any officer, director or member of the STA. The STA makes no representations as to the accuracy, completeness, or reliability of any information on the blog or found by following any link on blog, and none of the STA, STA Administrative Services or any current or past executive board members are liable for any errors, omissions, or delays in this information or any losses, injuries, or damages arising from its display or use. None of the information on the STA’s blog constitutes investment advice.
Latest Posts
- Why Your Post-Nominals Matter: MSTA & FTSA July 3, 2025
- How I Used Dow Theory to Strengthen My Market Convictions June 20, 2025
- The New Monetary Order: Russell Napier on Inflation, Debt, and Financial Repression June 12, 2025
- Why I Became (and remain) a Member of the STA May 29, 2025
- The Emotional Rollercoaster of Markets: Why Bubbles Repeat and How to Outsmart Them: Summary of Kim Cramer Larsson talk May 14, 2025


Latest Comments