


Tops and bottoms – Which is which?
In a week when Britain saw deflation for the first time in 55 years, and too many European government bonds yield less than nothing, one begins to question one’s sanity in this topsy turvy world.
It set me thinking about the type of price action of financial assets at tops and bottoms of secular trends, and whether we suffer from bias between these two. Certainly Elliott Wave Theory suggests that rallies move in fives, retreats in threes. The type of chart patterns we might look for at tops, especially following spectacular moves, are dramatic ones like island reversals, shooting star candles, and hanging men. Conversely at bottoms we would tend to be on the lookout for gentle rounded shapes, especially the closer we get to zero.
But what about the Foreign Exchange market, where moves are generally priced as one currency relative to another (and even the US Dollar Index is mainly calculated against the euro). Certainly when looking at a Cable chart, most will see last year’s drop as Sterling weakness; likewise for EUR/USD which trended steadily lower from July 2014 to April this year.
Looking at the pound against the euro, interbank dealers quote it as pence per euro. Bureaux de Change the other way round. This might be seen as the control in our little experiment.
Expectations and attitudes are hard to measure but a quick straw poll suggests that a rally for GBP/EUR is seen by most Brits as a ‘good thing’, triggering plans for a summer holiday on the continent, or idly dreaming of the villa in Provence or Tuscany (substitute as appropriate please).
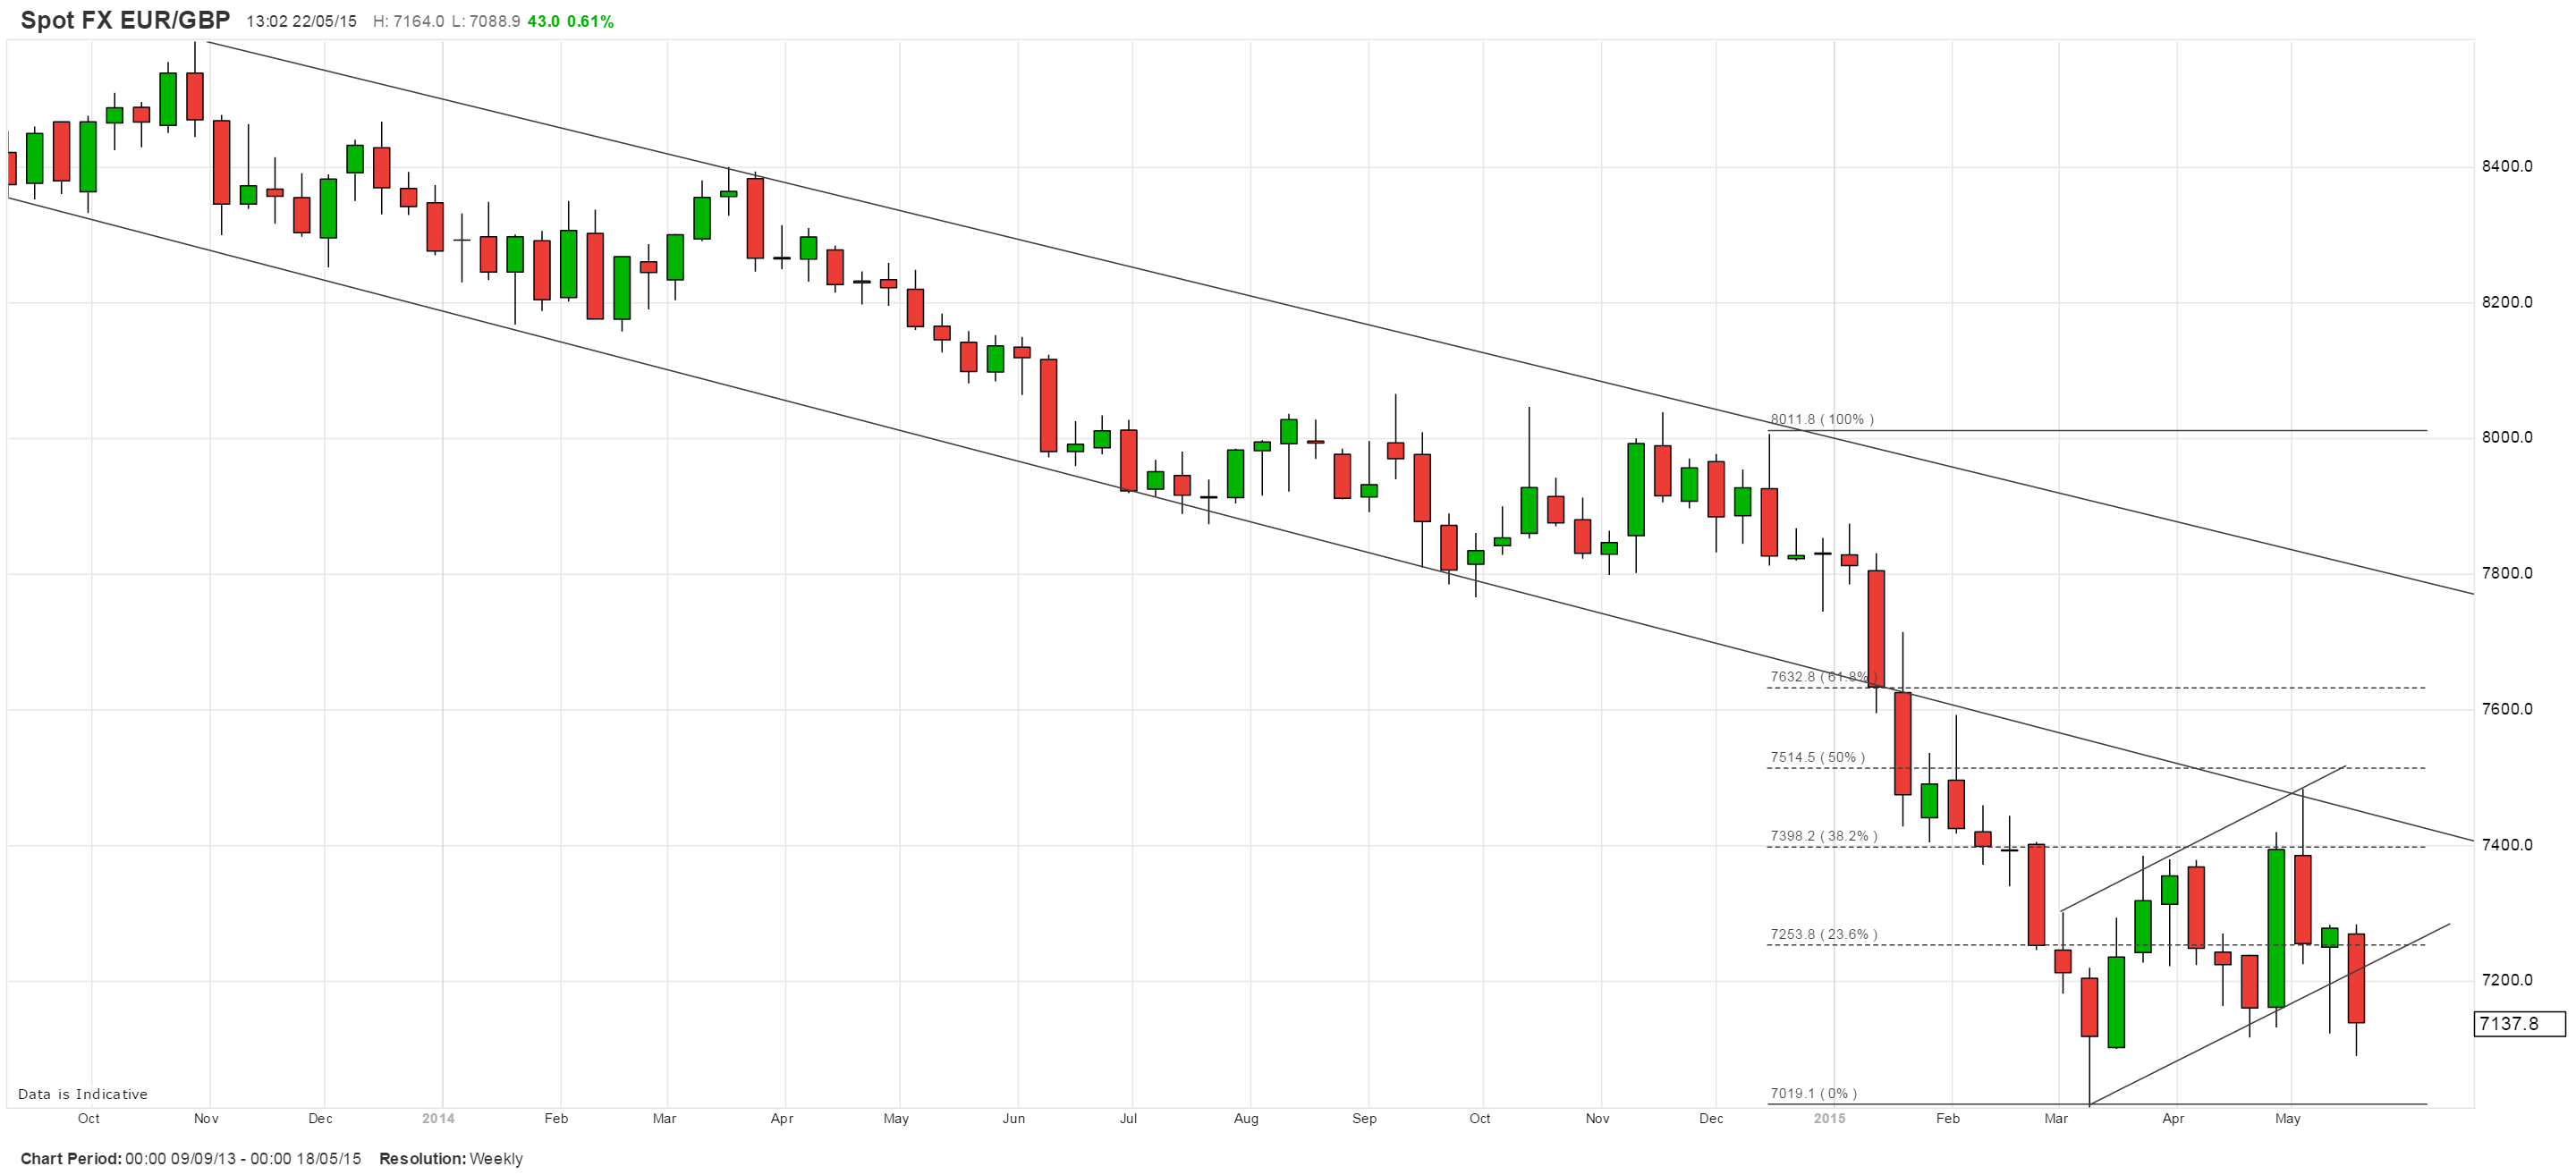
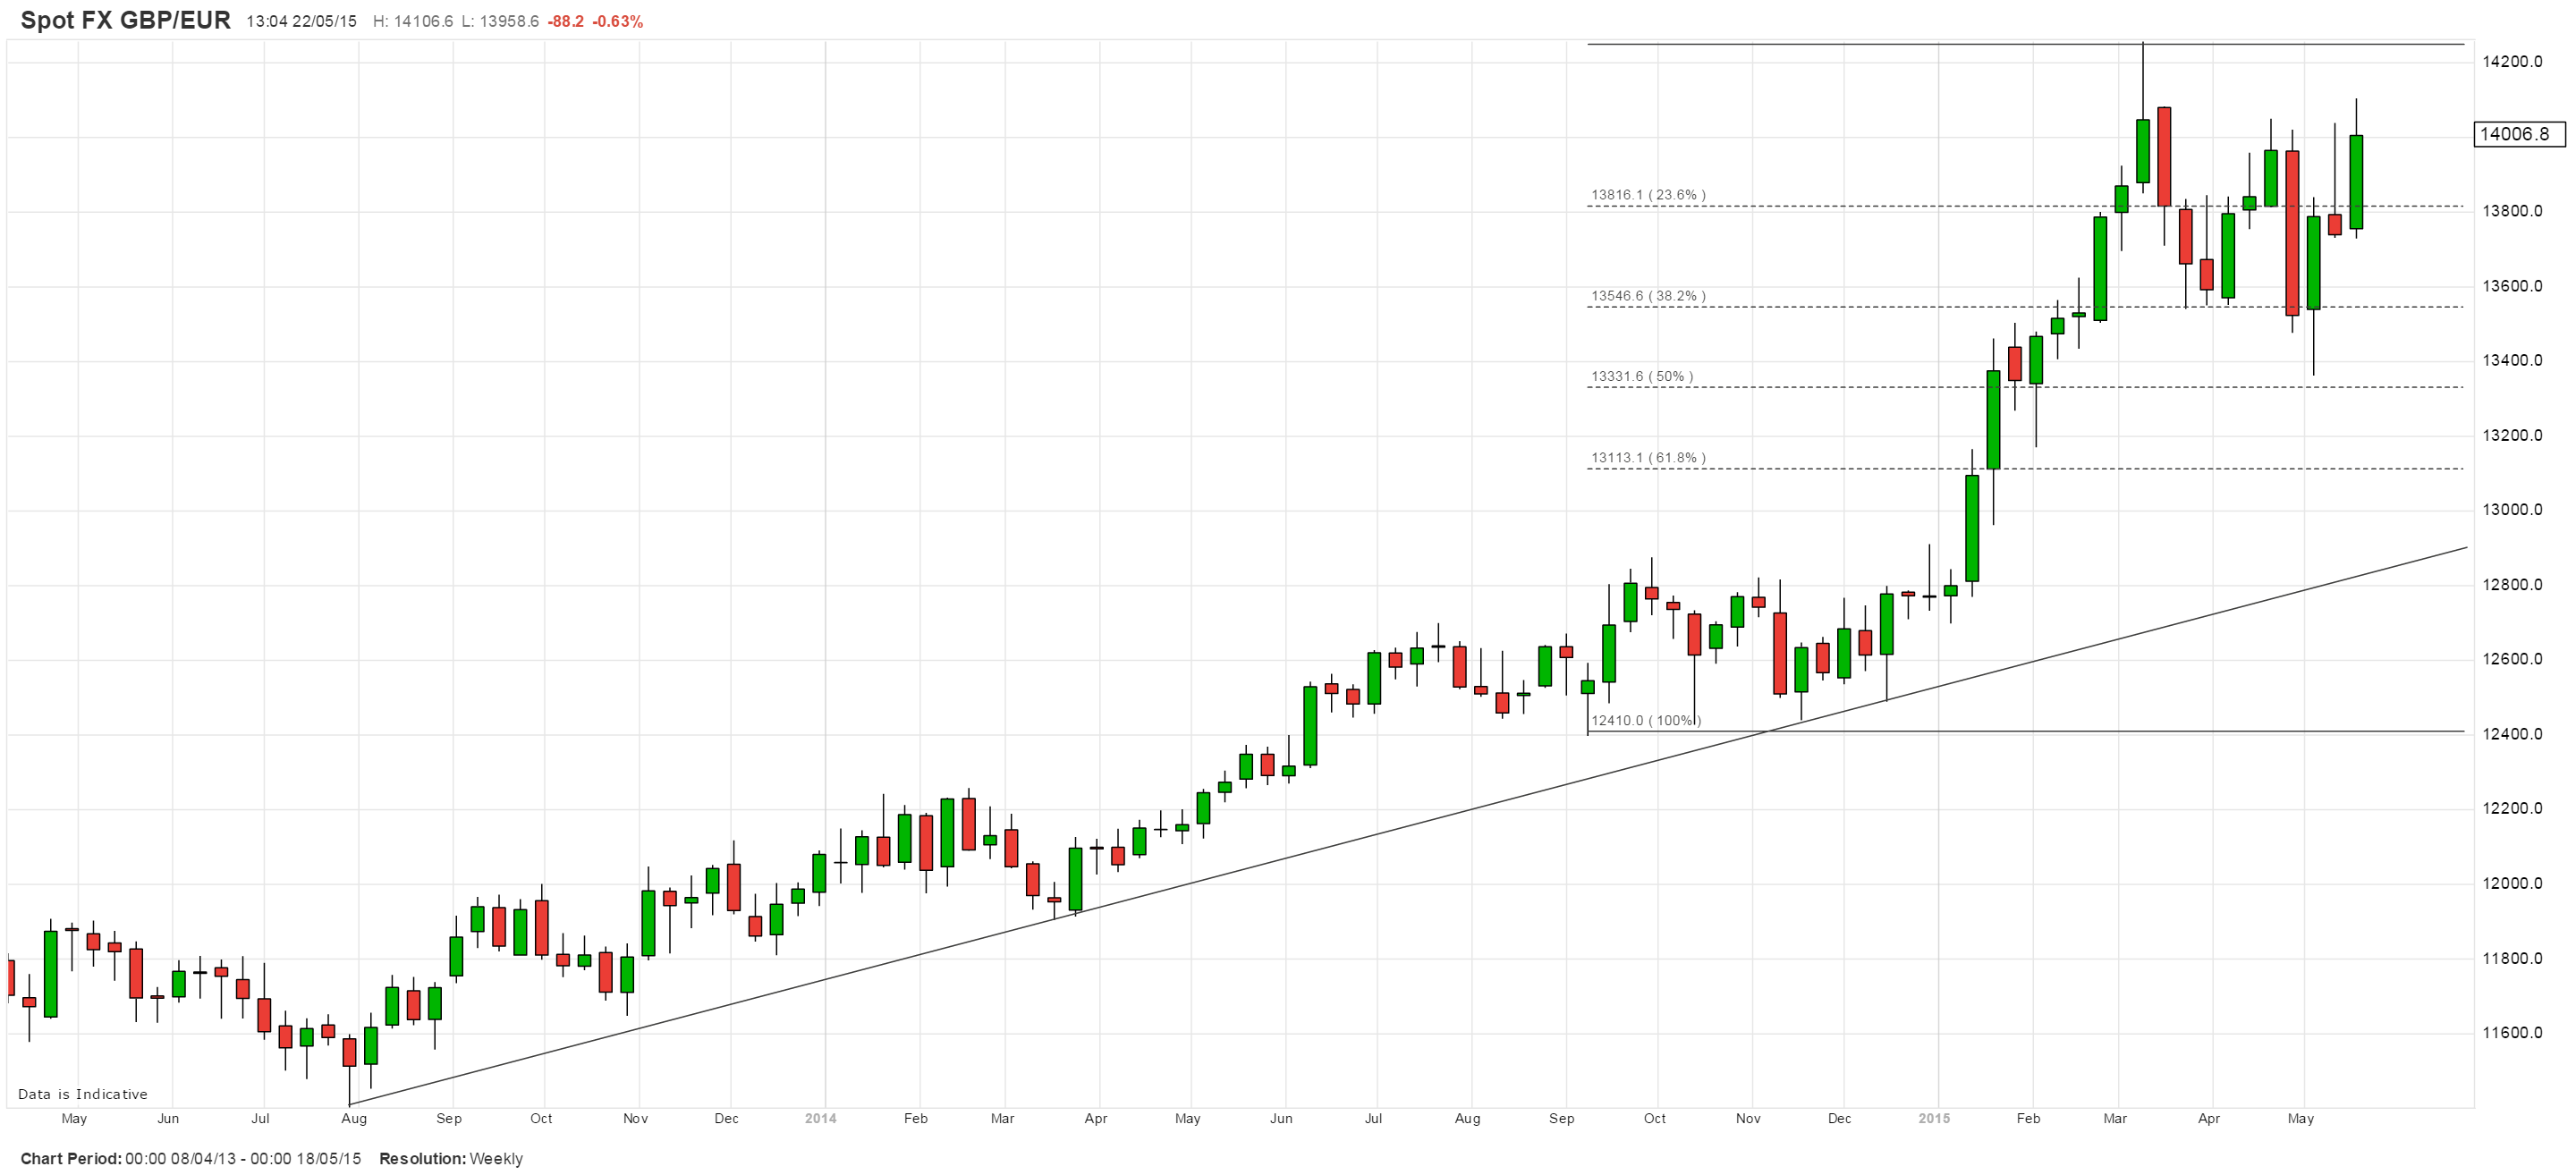 Now look at the two charts. What do you see? Do you care? Would a US or Russian citizen instinctively understand the difference between either of these? I’m not sure. And I’m also fairly certain that your typical technical analyst would roll up his or her sleeves and approach both charts just as they would a share price, stock index, or commodity for that matter.
But yes, it does matter; it matters a lot. Because one is missing the point. The value of a currency reflects what money is worth; interest rates its cost. Because it is always relative to a control group, it should react the same at both ends; but it doesn’t because of the laws governing big and small numbers – not technical analysis.
The views and opinions expressed on the STA’s blog do not necessarily represent those of the Society of Technical Analysts (the “STA”), or of any officer, director or member of the STA. The STA makes no representations as to the accuracy, completeness, or reliability of any information on the blog or found by following any link on blog, and none of the STA, STA Administrative Services or any current or past executive board members are liable for any errors, omissions, or delays in this information or any losses, injuries, or damages arising from its display or use. None of the information on the STA’s blog constitutes investment advice.


Latest Comments