


Thinking in ratios – Untangling price moves
Media wants attention and like any spoilt child, the beast will do anything to get it. So business headlines scream at us with emotive words like ‘slump’, ‘soar’, ‘crisis’ and ‘opportunity’. It’s difficult not to get swept up in it all and the risk is that the investor will lose money.
That same investor has a pre-set way of looking at things, usually as price per unit denominated in their currency of choice. Add to this the tendency to cover markets in a way that suits global preferences, and suddenly £1.5100 becomes the value of the pound; or perhaps £0.7200, or even €1.3888.
This problem is especially endemic in commodity markets, where crude oil becomes ‘cheap’ at $43 per barrel but ‘expensive’ at £1.14 at the pump. Similarly gold at $1190 will look cheap to many, but for the Japanese it is expensive at 4,800 Yen per gram.
One way of getting around the fixation on absolute price is to look at price relative, something that the stockbroking community have done for years – the individual share price relative to the index it is in. Commodity market participants tend to look at price ratios, mainly because they do not have good enough benchmarks. Yes, you might say, there is the CRB index. Well, but… it is too heavily weighted towards energy and gold.
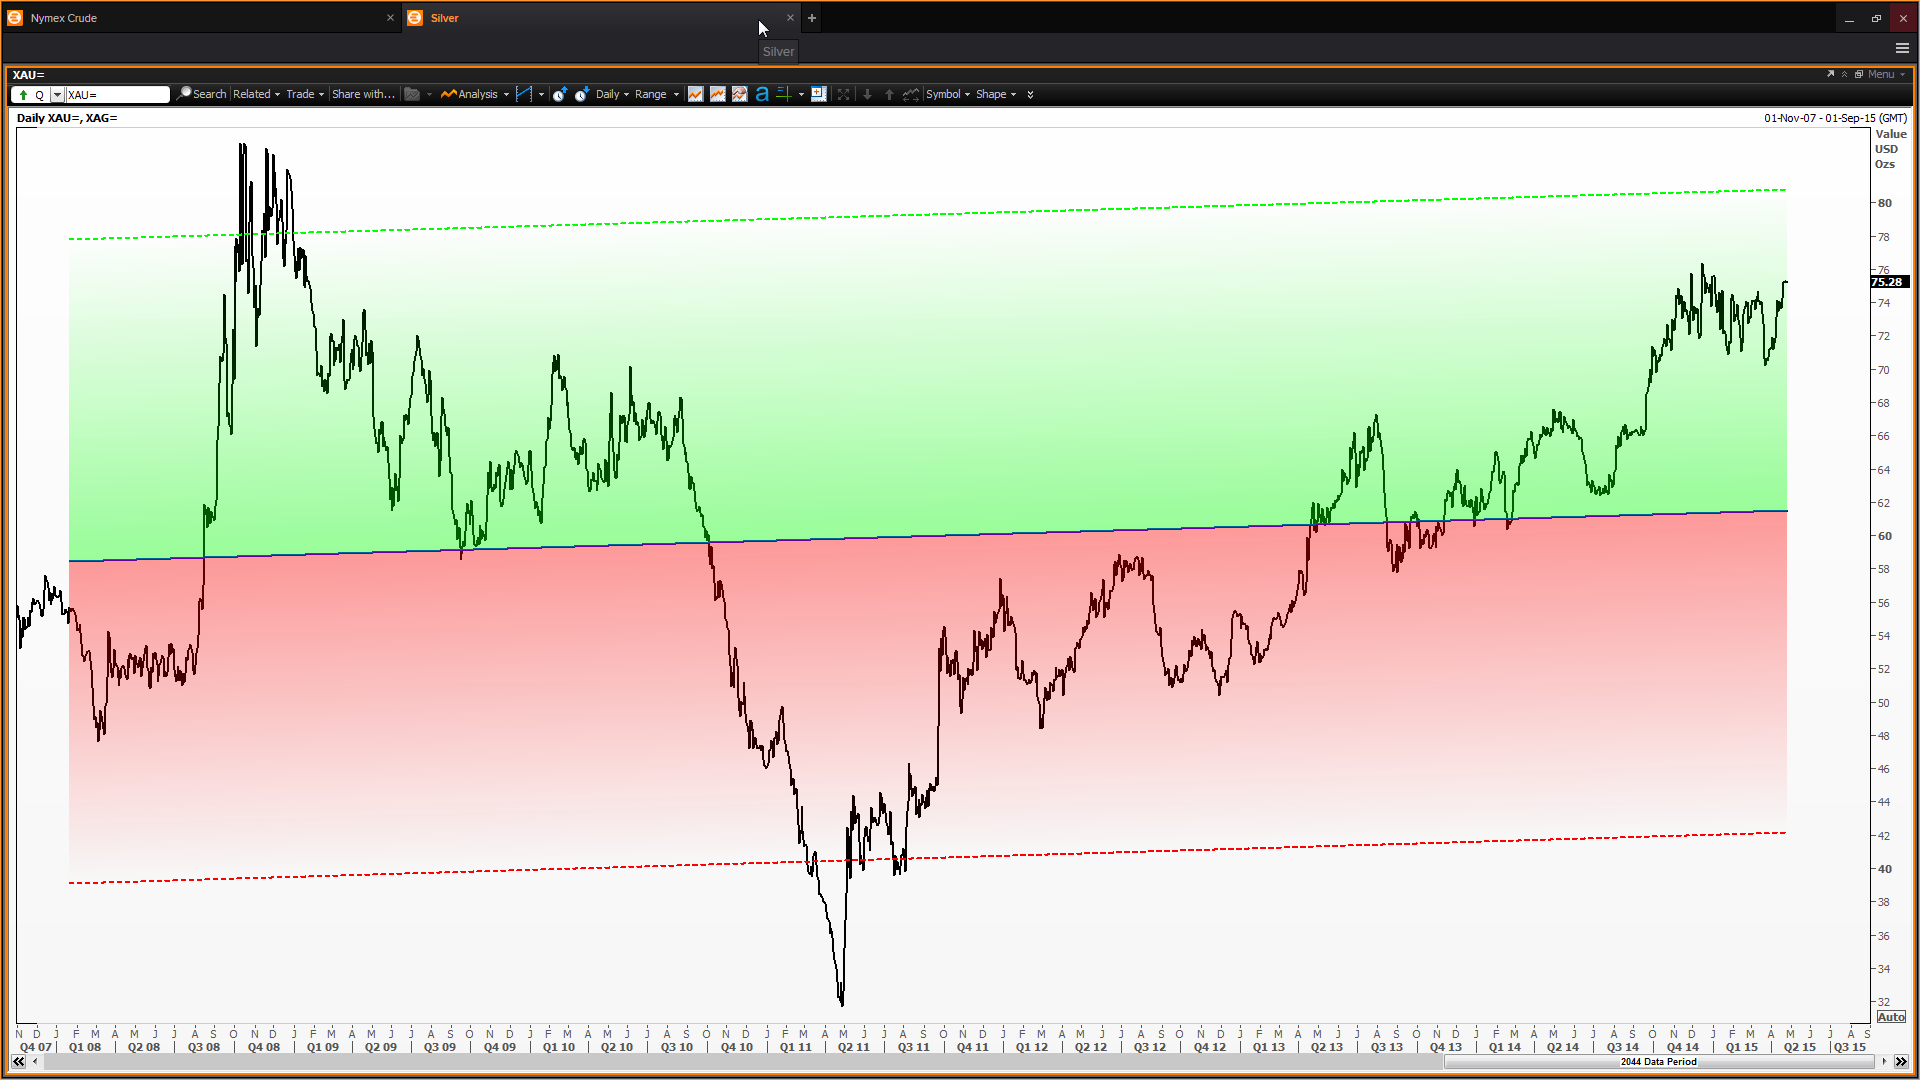
Two charts for you: an old favourite, the gold/silver ratio: how many ounces of silver do you need to buy one of gold – yes, denominated in US dollars again, I know. But you can begin to see which one is rising or falling faster than the other.
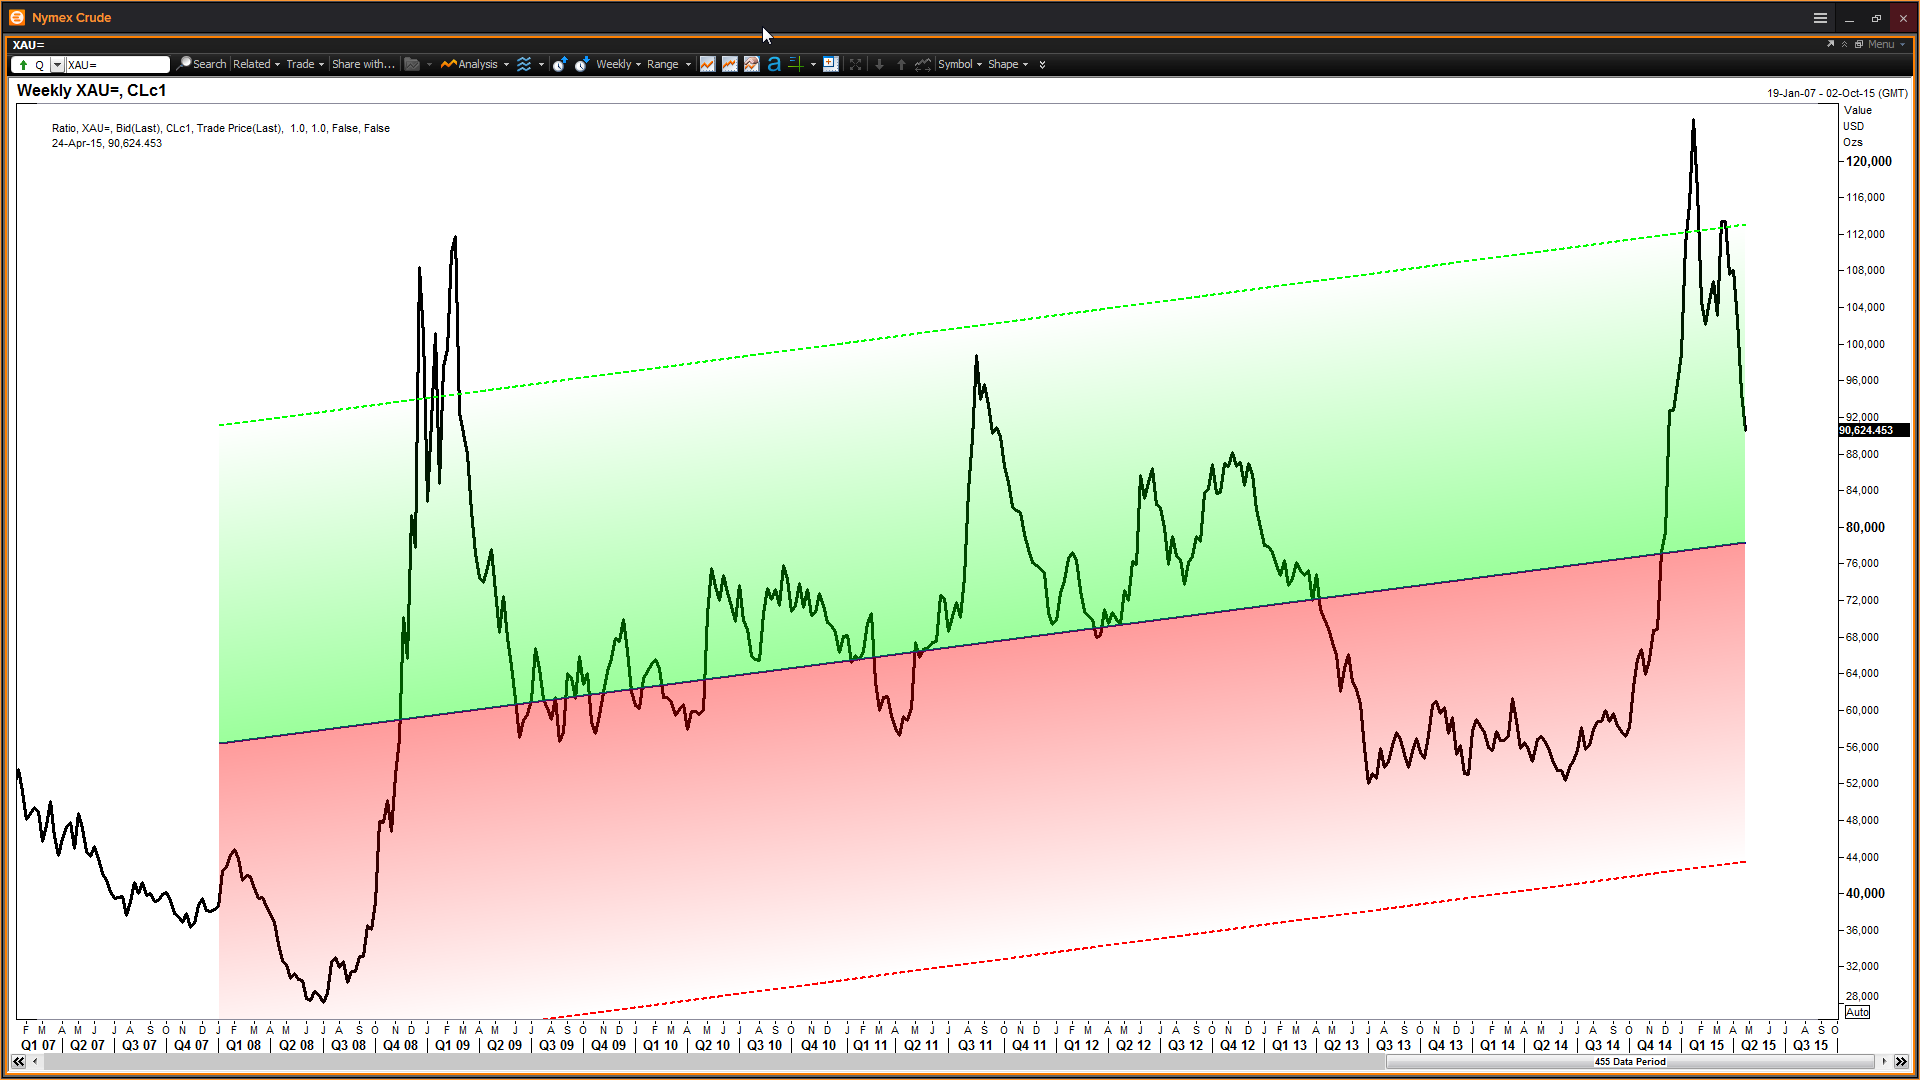
Slightly more unusual, the gold/crude oil ratio where one calculates how many barrels of oil will one ounce of gold buy. The chart shows the massive slide in the value of crude since July last year – a move similar to that in Q3 2008 – and the subsequent retreat back inside the two standard deviation band (the dashed green line).
Other interesting commodity ratios that you might like to look at are the ‘crack spread’ – crude versus gasoline or heating oil, and the soy bean crush – beans versus bean oil and mash.
Have fun!
Charts courtesy of Reuters.
The views and opinions expressed on the STA’s blog do not necessarily represent those of the Society of Technical Analysts (the “STA”), or of any officer, director or member of the STA. The STA makes no representations as to the accuracy, completeness, or reliability of any information on the blog or found by following any link on blog, and none of the STA, STA Administrative Services or any current or past executive board members are liable for any errors, omissions, or delays in this information or any losses, injuries, or damages arising from its display or use. None of the information on the STA’s blog constitutes investment advice.


Latest Comments