


Three-D printing – Been there, done that
You will have probably heard of the great new technological leap forward that is the ability to print in three dimensions. Not only will we eventually be able to make body part replacements, but I have been warned that the printers are likely to be commonplace in every house in the land. Put these ideas together for a truly gory outlook! Mary Shelley would be proud.
Thinking in 3D, and charting in the third dimension, are not new. Specialist providers like Bloomberg and Reuters have been supplying the know-how for years, but as these are not usually used by retail investors, I’d like to show you how they work.
Deliberately picking Cable (sterling against the US dollar) because of a general election a month away, this so-called ‘heat map’ shows the implied volatility on a series of different options on this currency pair. The higher the implied, not observed, volatility, the more the chart turns from green to red. This is plotted vertically, where the current minimum is 9.37% and maximum for this series is 16.40%.
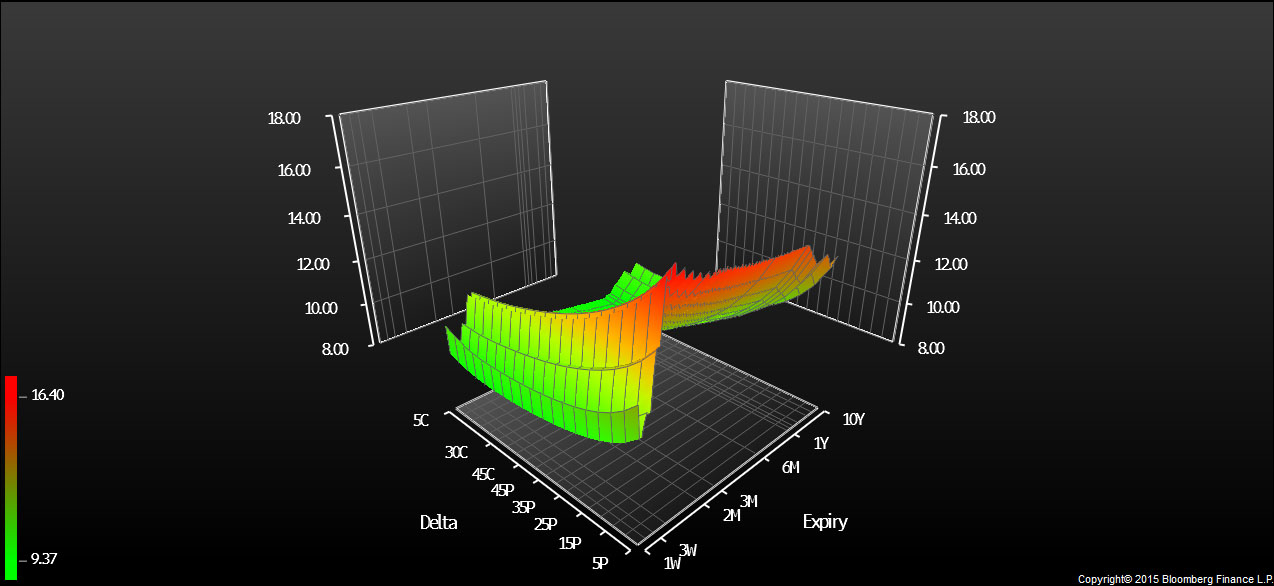
Of the two flat two-dimensional axes, one shows put and call strike prices, close to and far away from the current exchange rate (delta), while the other shows the time until the option matures. Labelled ‘expiry’, it is non-linear and shows one and three week, two months to six months, one year to ten year maturities. Delta, on the other axis, runs from 5 to 45 delta calls, with more detail on the 45 to 5 delta puts because this is where there is greater interest.
Why are puts more interesting? Because they are a lot more expensive – meaning investors are voting with their feet, buying insurance in case something goes badly wrong with the pound. Unsurprisingly the costliest option at the moment is a 5 delta put with an expiry 28 days from today. Right on time!
Front page on the Financial Times today is a dreary 2-D one-month volatility Cable chart; no idea what strike or delta they have chosen. STA members are many steps ahead.
Tags: election, Foreign exchange, FX, heat maps, UK, volatility
The views and opinions expressed on the STA’s blog do not necessarily represent those of the Society of Technical Analysts (the “STA”), or of any officer, director or member of the STA. The STA makes no representations as to the accuracy, completeness, or reliability of any information on the blog or found by following any link on blog, and none of the STA, STA Administrative Services or any current or past executive board members are liable for any errors, omissions, or delays in this information or any losses, injuries, or damages arising from its display or use. None of the information on the STA’s blog constitutes investment advice.


Latest Comments