


When oscillators lie: We often call it divergence
As John Maynard Keynes famously said, ‘’the market can stay irrational longer than you can stay solvent’’. Markets can also, unlike leopards, change their spots, moving from crushingly boring and lethargic for months to quite the raging tiger. This has been the case with spot gold recently, where it moved broadly sideways in a loosely defined band since February, only to sprint ahead in June. The blip above $1400, predictably, gathered the usual breathless reports in the media – often a contrarian signal.
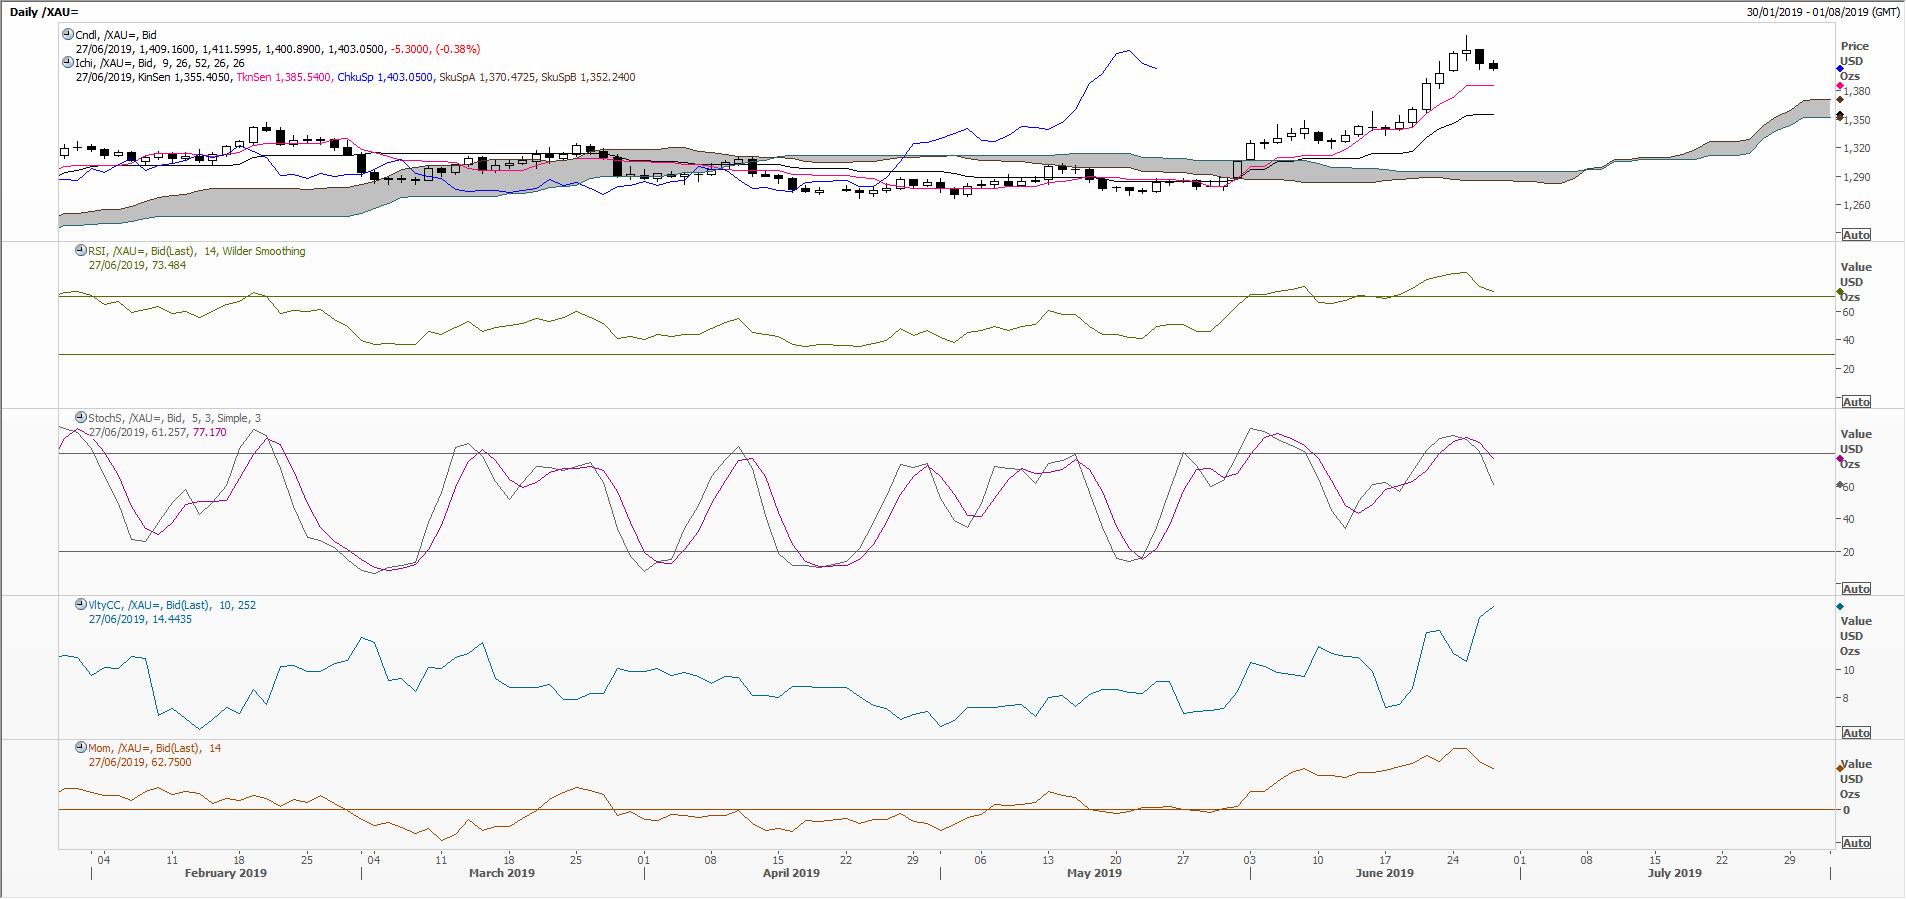
Because of this shift in its character, the Relative Strength Index became overbought early this month, flashing cautionary signals to all keen bulls. Equally unhelpful was the slow Stochastic which right from the very beginning of the rally was warning of exuberance and maybe overconfidence.
More helpful have been the two oscillators at the bottom of the chart. The blue line measures historical volatility based on the difference between the closing price one day and the next. Big daily rallies or falls will lead to increasing volatility – higher readings where there is no upper maximum and the lowest reading at zero. In our example it would have suggested that the bull market since May had legs and was gaining traction.
So too the bottom line measuring momentum which, when above the zero line indicates a bullish phase as compared to the price X days ago, where the default is usually 14 days. Again, we can see that things turned up early May but that this week it has waned. In all cases one would look to price action itself to see whether they back up what the oscillator is saying. If they don’t it’s known as divergence.
Every technical analyst has his or her preferred oscillators. The skill lies in second-guessing when the leopard is about to change its spots and pounce, and which technical analysis tools one should jettison along the way.
The views and opinions expressed on the STA’s blog do not necessarily represent those of the Society of Technical Analysts (the “STA”), or of any officer, director or member of the STA. The STA makes no representations as to the accuracy, completeness, or reliability of any information on the blog or found by following any link on blog, and none of the STA, STA Administrative Services or any current or past executive board members are liable for any errors, omissions, or delays in this information or any losses, injuries, or damages arising from its display or use. None of the information on the STA’s blog constitutes investment advice.


Latest Comments