


The value of volatility: Measures and comparisons
Approached by an STA member recently at a monthly meeting, he showed me a very interesting report by FTSE Russell, an organisation producing equity benchmarks and research on these, wholly owned by the London Stock Exchange Group. Of the five main indices in their FTSE Factsheet dated 31 March 2015 (attached below) look closely at their measures of volatility over the three time frames.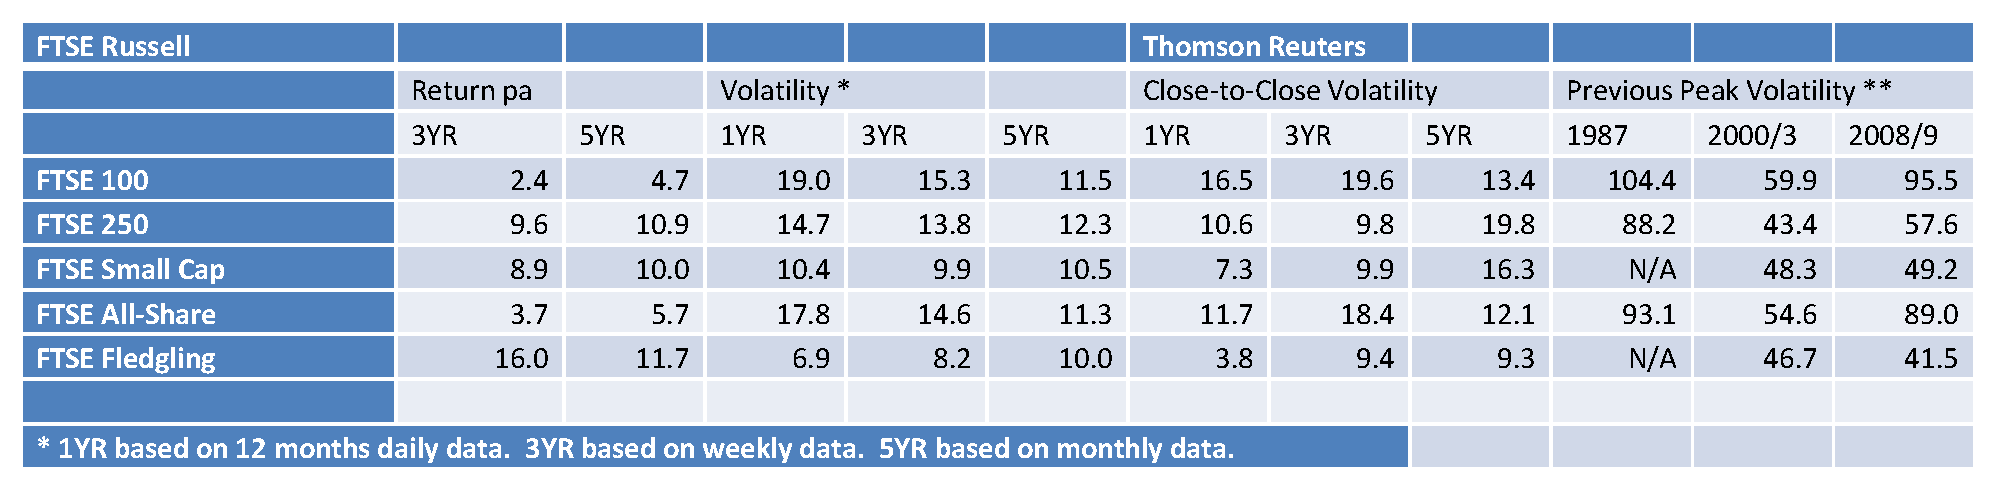
Our eagle eyed member saw the glaring difference between data for the fledgling index versus the biggest 100 UK companies. Less than half as volatile over some time frames it gives the lie to the old wives’ tale that small companies are not suitable for widows and orphans.
Contacting FTSE Russell for more information, thinking it might be down to the formula they use to calculate volatility, I attach this for those with a mathematical bent.
![]() where n is the number of periods (days, weeks or months in this case), r the average return over n periods, and T the annualising factor (252 for daily data, 52 weekly, and 12 monthly). This is considered a fairly standard calculation.
where n is the number of periods (days, weeks or months in this case), r the average return over n periods, and T the annualising factor (252 for daily data, 52 weekly, and 12 monthly). This is considered a fairly standard calculation.
Then look at the data provided by Thomson Reuters, admittedly using a marginally different calculation, based on the difference between closing prices. We then compared these, on this same basis, to previous historical volatility peaks/market crashes.
You decide whether volatility in Q1 2016 really was as high as some think it was. Or is it time to sort the men from the boys?
Tags: large cap, small cap, stock markets, UK indices, volatility
The views and opinions expressed on the STA’s blog do not necessarily represent those of the Society of Technical Analysts (the “STA”), or of any officer, director or member of the STA. The STA makes no representations as to the accuracy, completeness, or reliability of any information on the blog or found by following any link on blog, and none of the STA, STA Administrative Services or any current or past executive board members are liable for any errors, omissions, or delays in this information or any losses, injuries, or damages arising from its display or use. None of the information on the STA’s blog constitutes investment advice.


Latest Comments