


Truly international TA: A common language
Technical analysis is truly international, not just because it has practitioners spread across the globe but because it is a common language we can all understand and relate to. It is another lingua franca, not like Esperanto but like maths, music, or algebra. Those who never learnt to read the script will just see it a swirls and squiggles, gobbledygook, but for those in the know the logic, song and elegance shine through.
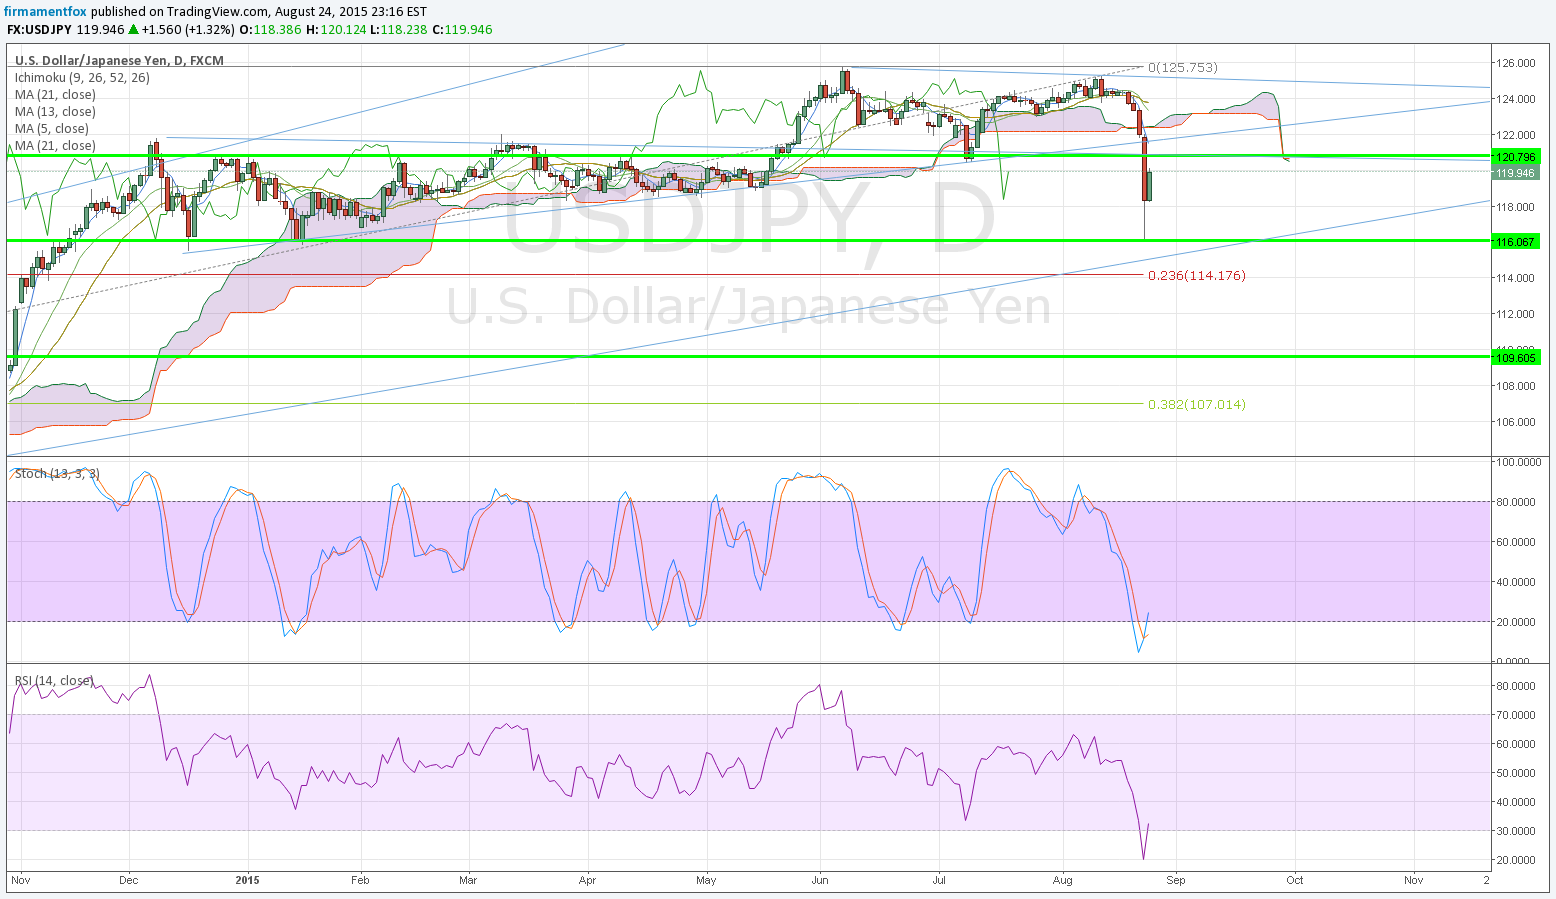
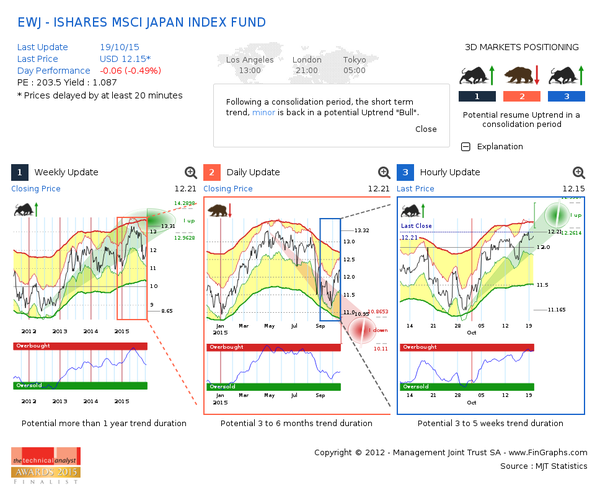
With this in mind I think it is very important to be rigorous in one’s annotation of charts. Start with labelling the instrument in a way that anyone around the world will know what it is. Avoid codes (because these differ between data providers) and state on which exchange they are traded (and which sessions are used) if applicable. Likewise oscillators, volume, and open interest on any sub-charts.
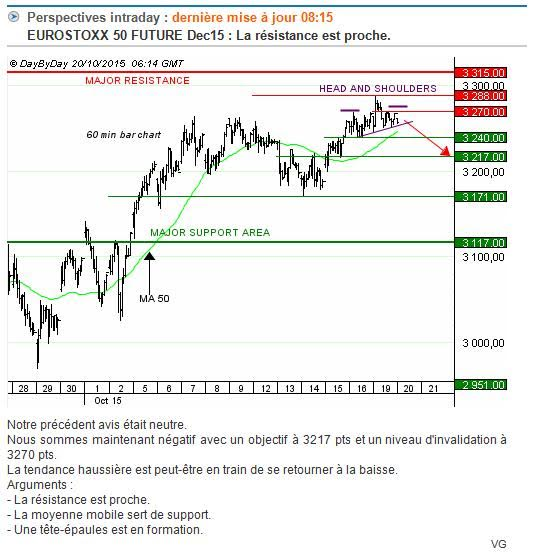
Now to the analysis itself. Lines should be drawn exactly, with points of contact unambiguous. Chart patterns should be drawn completely, so a rectangle should have four sides, show the flagpole of a pennant, and all edges of a diamond. Consider labelling a double bottom with a ‘W’ and double top with an ‘M’ and marking the starting and ending points exactly. Use arcs (∩) to denote heads and shoulders as well as drawing a point to point neckline. Add numbers for the length of the moving averages. Mark other salient chart features by circling them or pointing them out with an arrow on the chart.
Equally important when describing one’s analysis and market outlook is to write clearly, well, and preferably briefly. Avoid jargon, slang, abbreviations and probably descriptive words too. Ensure spelling and punctuation are up to scratch as sloppiness can lead to ambiguity. Consider the use of symbols like ‘+’, ‘-‘, ‘@’ and ‘&’ to describe your trading strategy.
Why bother you may say, when English (and the dreaded Globish) are so widely used today? Because you may want to reach a wider audience. Because you may hope to learn from other practitioners. Because it is a courtesy to all your readers. I attach charts below written by technical analysts where English is not their first language. Your task is to spot what they are and what the analysis is saying.
Tags: oscillators, pattern, Trend line
The views and opinions expressed on the STA’s blog do not necessarily represent those of the Society of Technical Analysts (the “STA”), or of any officer, director or member of the STA. The STA makes no representations as to the accuracy, completeness, or reliability of any information on the blog or found by following any link on blog, and none of the STA, STA Administrative Services or any current or past executive board members are liable for any errors, omissions, or delays in this information or any losses, injuries, or damages arising from its display or use. None of the information on the STA’s blog constitutes investment advice.


Latest Comments