


Trend channels extraordinaire: See palladium fly and platinum sag
Normally in soaring markets one is guaranteed oscillators that cannot cope, almost non-existent consolidation phases – and therefore few recognisable chart patterns – and moving averages that lag badly. Associated with such moves investors start hyperventilating, suggesting the sky’s the limit, and the media is all over it like a rash. Cassandras stuck on the side-lines warn that it’ll all end in tears
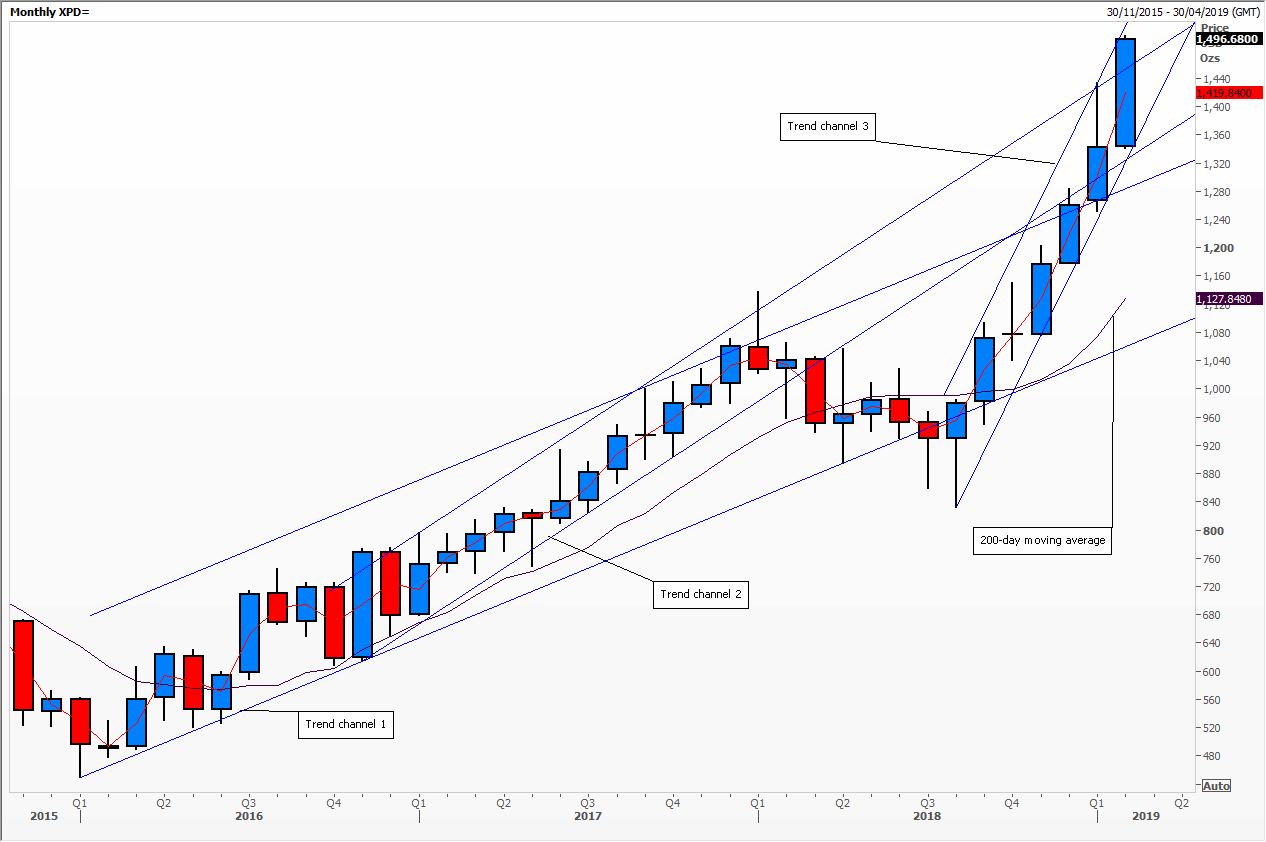
Every now and again charts prove these sentiments wrong, which I suggest is the case with spot palladium. As you can see since January 2016 it has more than tripled in price from the $450 per ounce area where it had traded many times since 1998, and is now at a new record high – well above the previous parabolic peak in 2001.
Palladium
But the move, rather than being chaotic, has held neatly within clear trend channels. The first one has the slowest rate of ascent with a second steeper one inside it that contains 2017’s rally. This then stalls with a shooting star monthly candle and the 50-day moving average dips below the 200-day one.
This gentle correction ends with two consecutive hammer candles with lower shadows just below trend channel 1. These then kick off a golden cross and an even steeper rally inside trend channel 3 which takes the market through the top of trend channel 1 and back inside the second one. This is a good example of how rates of change ebb and flow, providing support to the long-term trend.
The second chart is not nearly as clear, and is of spot platinum which has seen a series of price declines for many of the years since 2008’s record high. It too has three distinct trend channels – wider than those of the first example – but also accelerating. There have been more consolidation phases to the secular bear market, hence the wider bands, no gaps and few dramatic candles suggesting this is certainly not a market skidding out of control. We have, however, met secular long term support.

Platinum
Perhaps it’s time for the trend channels to change.
The views and opinions expressed on the STA’s blog do not necessarily represent those of the Society of Technical Analysts (the “STA”), or of any officer, director or member of the STA. The STA makes no representations as to the accuracy, completeness, or reliability of any information on the blog or found by following any link on blog, and none of the STA, STA Administrative Services or any current or past executive board members are liable for any errors, omissions, or delays in this information or any losses, injuries, or damages arising from its display or use. None of the information on the STA’s blog constitutes investment advice.


Latest Comments