


‘Too Much and Never Enough: My Family Created the World’s Most Dangerous Man’ – A tell-all memoir by Mary Trump
Unsurprisingly this book, published on the 14th July 2020 and which her uncle, the US President tried to ban, sold 1 million copies in its first day! From some of the brief book reviews I’ve read, Fred Trump Senior (Donald’s Dad) comes across as a particularly nasty specimen who moulded and manipulated his five children and disinherited Mary and her brother.
This set me thinking of how money – and lack of – sets its imprint in a child’s mind and then we find it difficult to shake off this relationship; it’s actually a very emotive connection. Obviously, all of us need a sense of security, and money is probably the most useful cushion against hardship. This in itself may, or may not give us greater freedoms, choices and fulfilment. Loads and loads of money often creates new anxieties, both personal and financial, while too little does so too. The gist of it is: enough money will do; the Goldilocks scenario.
And what’s all this got to do with technical analysis, you ask. It does, in terms of setting sensible investment return targets, spending wisely for pleasure as well as stashing it away. Recognising when a tantalising trinket is just that – and unnecessary. That more money does not equate to status.
Chart analysis and some of its oscillators can help warn when a move is out of control or long in the tooth, suggesting that it’s time to step aside and leave some ‘for the birds’. A handful of stocks and commodities today are gapping higher in parabolic bull trends; worrying and worth keeping a close eye on. Relative Strength Index might help, the Rule of 8-10 likewise, as too Tom DeMark’s Sequential which uses 9 and 13 consecutive moves.
Another warning signal is when one instrument is booming or collapsing, while other related vehicles are not joining in, meaning the ratios between them are becoming extreme – like gold/silver, crude oil/gold, and more recently FAANGS versus the value of the whole Russel 2000 index.
Then of course, we have our slow chart patterns, like head-and-shoulders and rounded tops, or our dramatic ones like a shooting star or hammer candle, and island reversals.
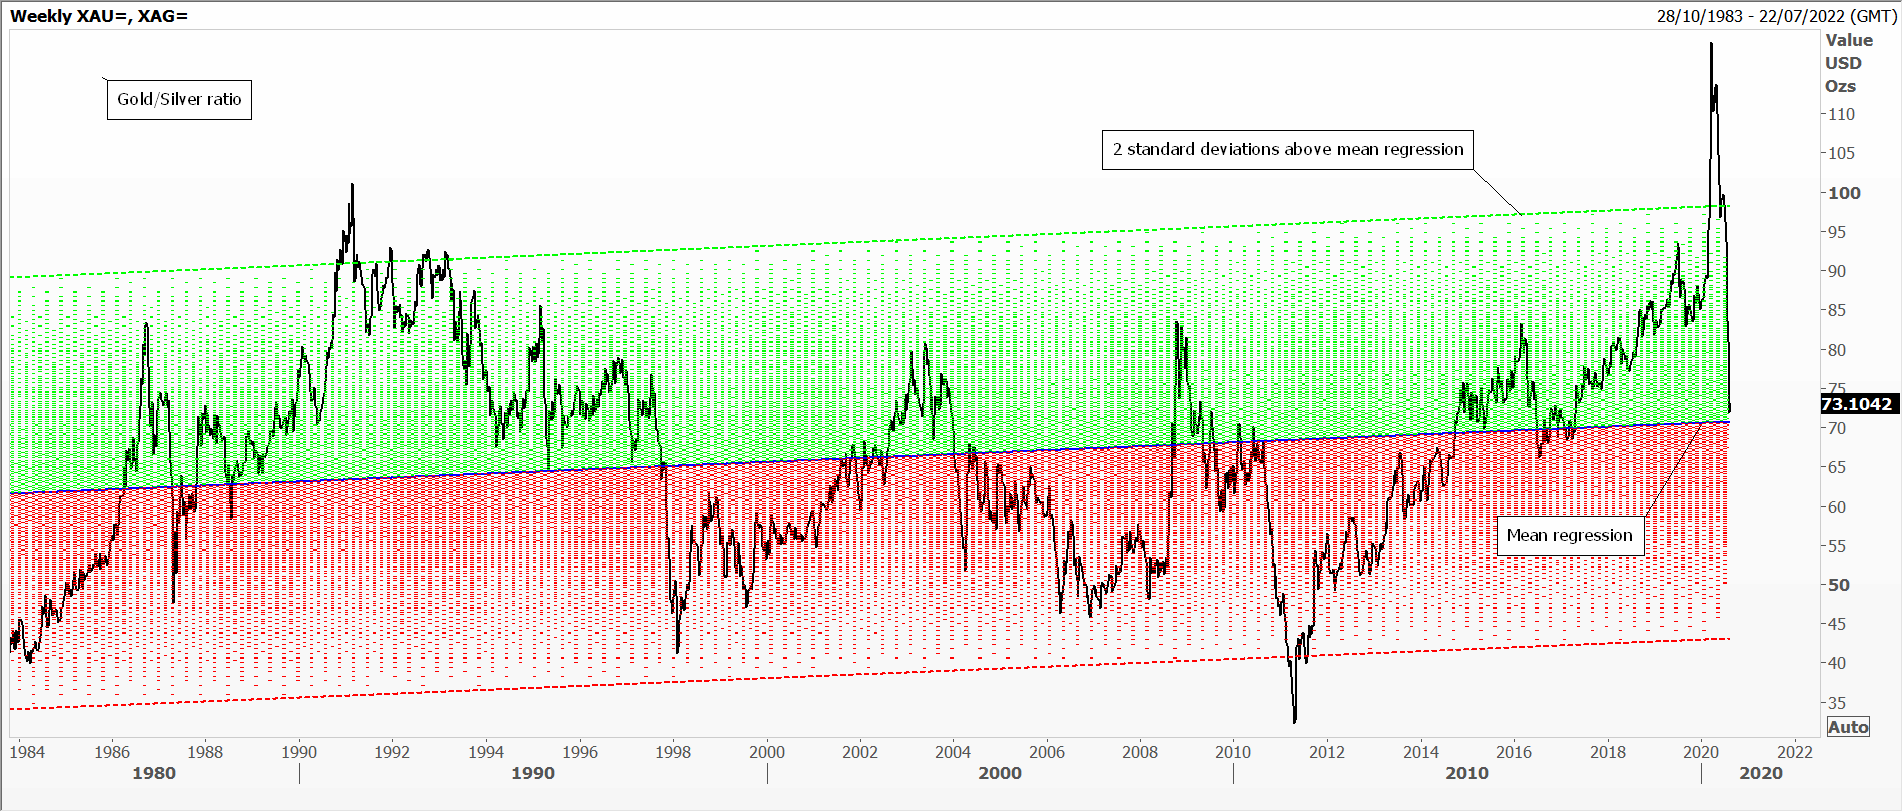
Ratio
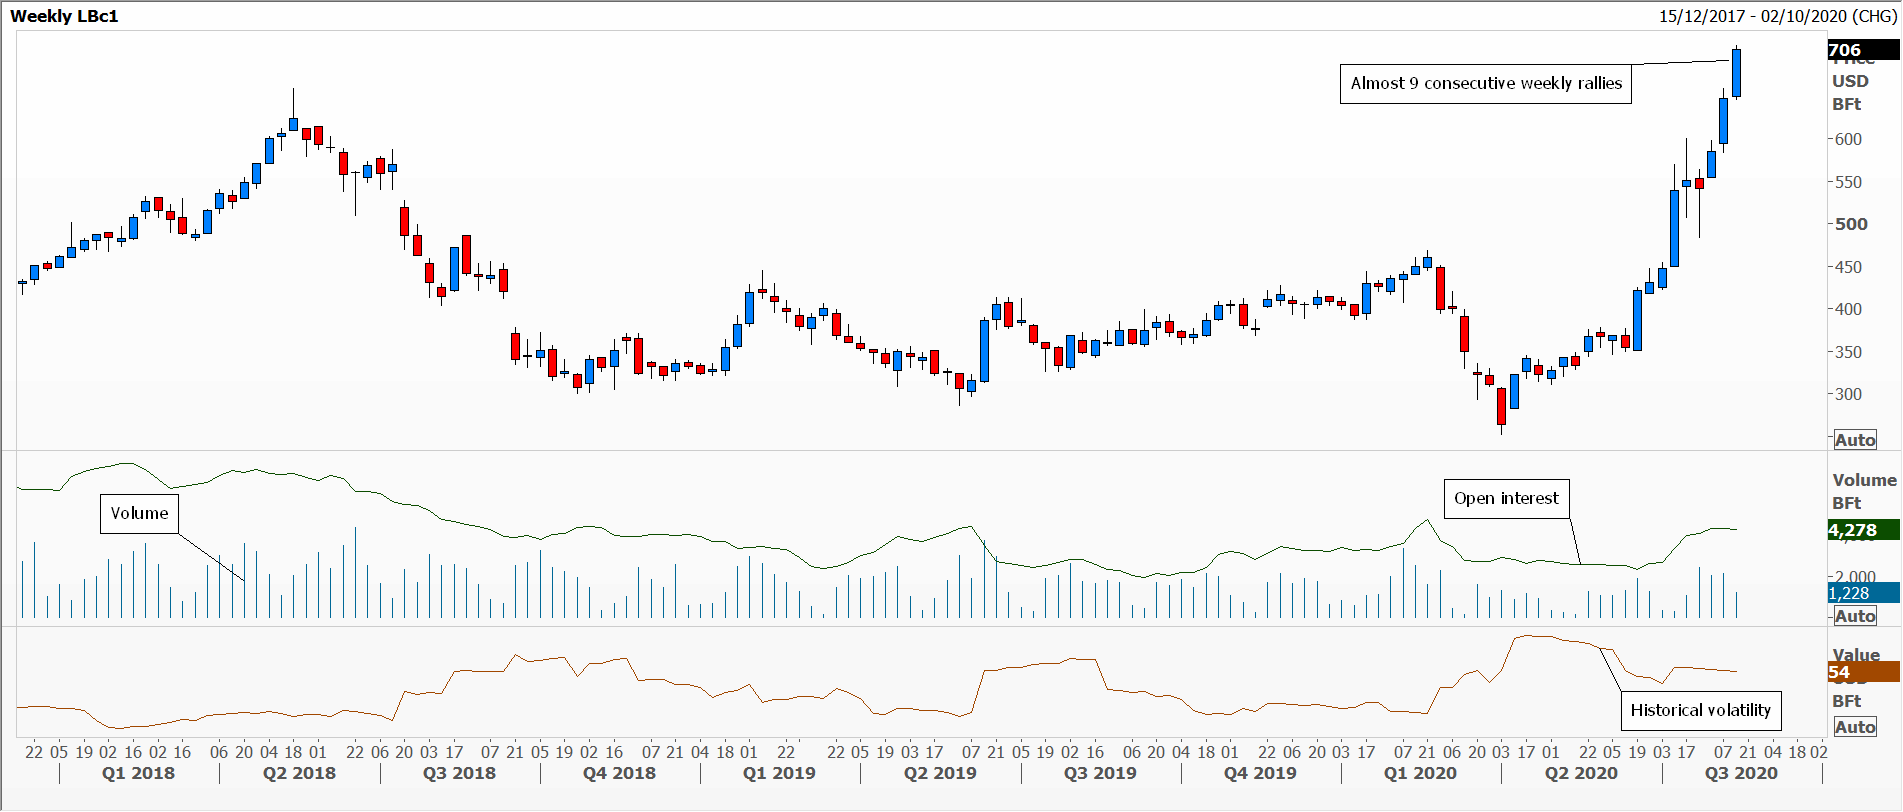
Lumber
The views and opinions expressed on the STA’s blog do not necessarily represent those of the Society of Technical Analysts (the “STA”), or of any officer, director or member of the STA. The STA makes no representations as to the accuracy, completeness, or reliability of any information on the blog or found by following any link on blog, and none of the STA, STA Administrative Services or any current or past executive board members are liable for any errors, omissions, or delays in this information or any losses, injuries, or damages arising from its display or use. None of the information on the STA’s blog constitutes investment advice.


Latest Comments