How best to present technical analysis: Media formats and delivery systems
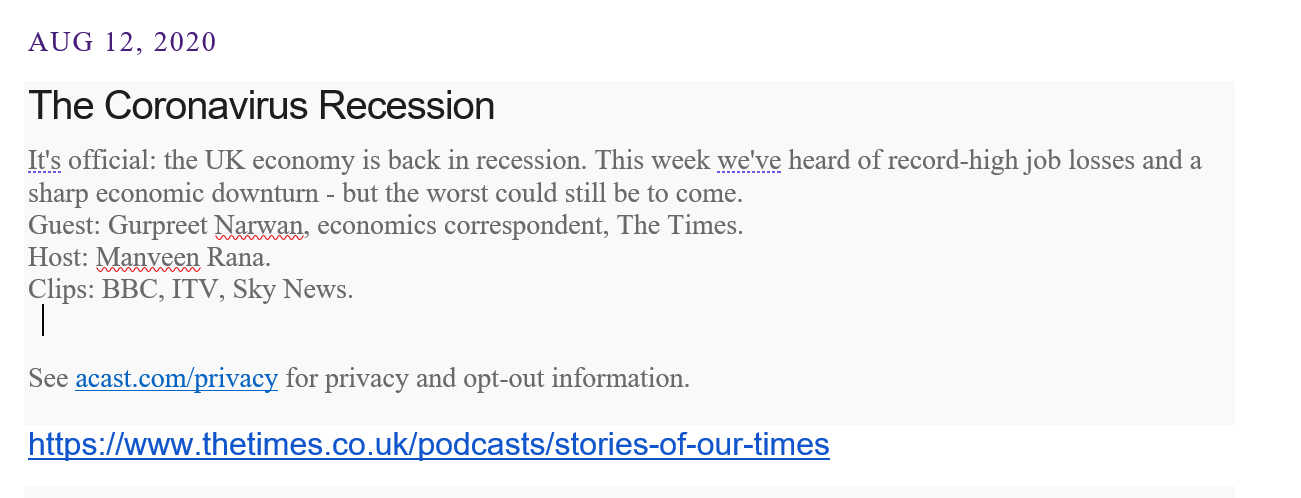
My daughter, an international news journalist, has been increasingly asked to do radio work. She does daily, weekly and monthly print offerings for mainstream media, as well as television coverage of breaking news, plus magazine features. She was the one who sent me this link about Britain and the corona virus pandemic.
She came across this because she’s been enlisted by the brand new Times radio station. The fact that old salt Rupert Murdoch has decided to branch into this new (for him) medium is telling. Podcasts – voice only media – have seen their popularity growing strongly; I see them as the 21st century version of the radiogram. It’s because one can listen and do something else at the same time.
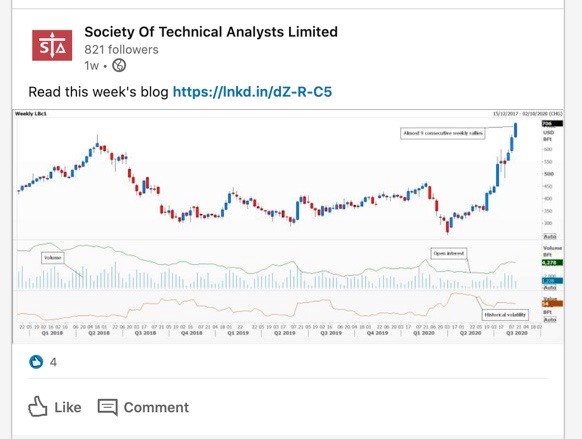
However, as the ladies in the podcast above bemoan in minute 2:45, they cannot show the charts as they would do in print. They then go on to say in minute 13 we are ‘’literally off the charts’’ (in terms of the economy). This is a serious problem for technical analysis presentations and discussions.
Therefore I would opt for video or TV, and of course print, when possible. My suggestion would be to focus on the charts, with a brief mug shot or snippet of the presenter introducing the piece. Charts should be clear and pared back to the bare bones of what’s being discussed. Make them as big as possible because many of them might be viewed on rather tiny mobile gadgets.
This is especially the case when publishing on social media. Here, first and foremost, choose carefully between platforms; the choice will reflect on your work and might possibly be detrimental to it.
How frequently and when to publish should also be considered. Banging out the same material endlessly, like so many advertising campaigns do, is dreary and makes your work look old hat.
You could create YouTube videos or better still, stream directly from your computer using the chart you are currently working on. Make sure the cursor is as big and bold as it’ll go, and then you can also draw lines and things as you go along. The kit needed is not as expensive as you might think and your voiceover will explain what you’re doing as you go along. Don’t make it too long; attention spans have shrunk tremendously.
Placing a paid for article or advert in a newspaper might be an idea. It’s an industry on its knees and crying out for an income stream. Again, don’t be tempted to let your face do the talking; it’s the chart that counts.
Tags: Content, Image, media, Voice
The views and opinions expressed on the STA’s blog do not necessarily represent those of the Society of Technical Analysts (the “STA”), or of any officer, director or member of the STA. The STA makes no representations as to the accuracy, completeness, or reliability of any information on the blog or found by following any link on blog, and none of the STA, STA Administrative Services or any current or past executive board members are liable for any errors, omissions, or delays in this information or any losses, injuries, or damages arising from its display or use. None of the information on the STA’s blog constitutes investment advice.
Latest Posts
- Living in a land of large numbers: How to get a grip July 24, 2024
- Debate with ACI UK, The Broker Club & The Commodities Trading Club: Forecasts for the second half – plus marks for first half July 10, 2024
- Retail traders embrace volatility: Zero-day options and penny stocks on today’s menu June 24, 2024
- STA members and their guests get a dose of hypnotherapy June 12, 2024
- ‘And it’s a goal! Again’ Rectangles, corsets and straightjackets May 28, 2024


Latest Comments